Google Classroom
Google Classroom
GeoGebra
Aula GeoGebra
Valideu-vos
Cerca
Google Classroom
Google Classroom
GeoGebra
Aula GeoGebra
Esbós
Algebra 1
Statistics
Solving Linear Functions and Inequalities
Graphing Linear Functions
Writing Linear Functions
Algebra 1
Autor:
Thomas Gebbie
Tema:
Àlgebra
Taula de continguts
Statistics
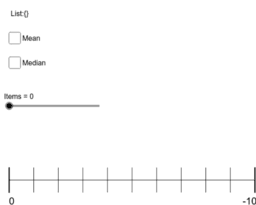
Dot Plot Generator
Box and Whisker Practice #2
Compare Box and Whisker Plots
Solving Linear Functions and Inequalities
Algebraic Proof Justification 1
Algebraic Proof Justification 2
Literal Equations Proof Justification
Graphing Linear Functions
Investigate the relationship between the three forms of line
First, use the sliders to create the parent function, y = x.
DIGI203-3D #8
Writing Linear Functions
Point Slope Form Matching
Slope Intercept Form Matching
Equivalent Linear Equations Matching
Següent
Dot Plot Generator
Nous materials
Slope and Road Signs
Random Polar Curve (3)
Model sferyczny - sześcian-ośmiościan
¿Quién llegará más lejos en el mundial?
גיליון אלקטרוני להעלאת נתוני בעיה ויצירת גרף בהתאם
Descobriu materials
edmodo
Dreiecksschwerpunkt mit Werkzeug
Tesselation Sofia S
Function Transformation
Movement of a bug on a tooth paste box
Descobriu Temes
Rectangle
Arrels
Polígons
Cercle
Correlació