Google Classroom
Google Classroom
GeoGebra
GeoGebra Classroom
Abrir sesión
Buscar
Google Classroom
Google Classroom
GeoGebra
GeoGebra Classroom
Esquema
S2,3,5 Statistics
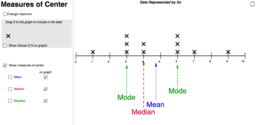
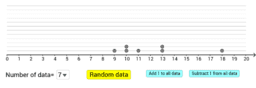
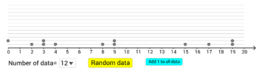
Measures of Center - Dot Plot
Measures of Central Tendency 集中趨勢的量度
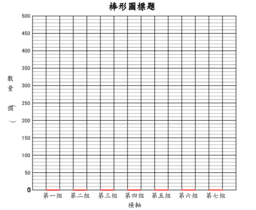
棒形圖製作器
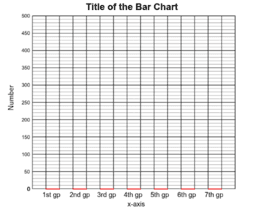
Bar Chart Plotter
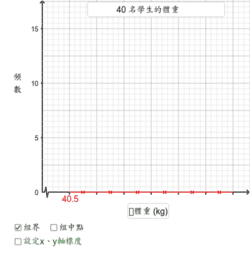
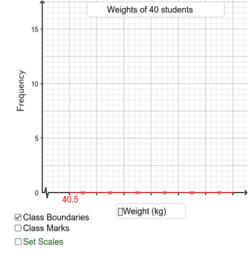
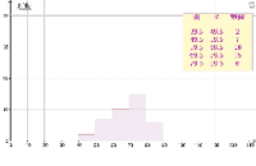
製作組織圖
Drawing Histograms
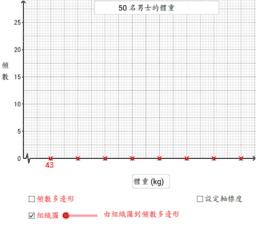
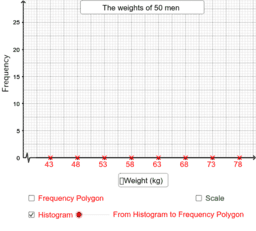
由組織圖到頻數多邊形
From Histograms to Frequency Polygons
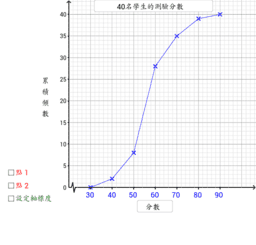
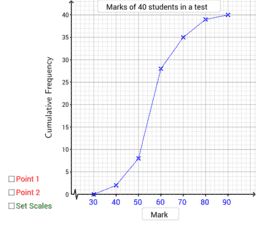
累積頻數多邊形的應用
Cumulative Frequency Polygon
累積頻數多邊形
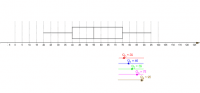
Quartiles and Box Plot (one data set) 四分位數與框線圖(一組數據)
Quartiles and Box Plot (two data sets) 四分位數與框線圖(比較兩組數據)
Quiz on Quartiles and Box Plot 四分位數與框線圖:測驗
Cumulative Frequency Properties
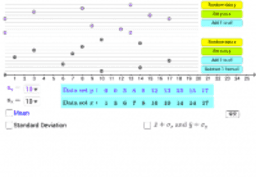
Standard Deviation (two data sets) 標準差(比較兩組數據)
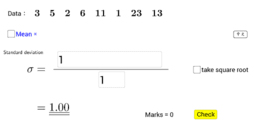
標準差:測驗
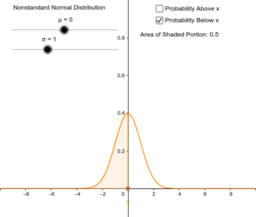
Standardizing the Normal Distribution
Box and Whisker plot
S2,3,5 Statistics
Autor:
tkyggb
Tema:
Histograma
,
Estadística
S2 Statistics, Histogram, Frequency Polygon, Frequency Curve, Cumulative Frrequency
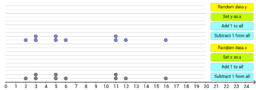
Measures of Center - Dot Plot
Measures of Central Tendency 集中趨勢的量度
棒形圖製作器
Bar Chart Plotter
製作組織圖
Drawing Histograms
由組織圖到頻數多邊形
From Histograms to Frequency Polygons
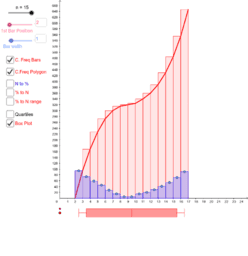
累積頻數多邊形的應用
Cumulative Frequency Polygon
累積頻數多邊形
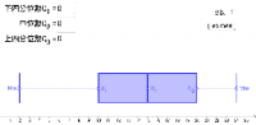
Quartiles and Box Plot (one data set) 四分位數與框線圖(一組數據)
Quartiles and Box Plot (two data sets) 四分位數與框線圖(比較兩組數據)
Quiz on Quartiles and Box Plot 四分位數與框線圖:測驗
Cumulative Frequency Properties
Standard Deviation (two data sets) 標準差(比較兩組數據)
標準差:測驗
Standardizing the Normal Distribution
Box and Whisker plot
Siguiente
Measures of Center - Dot Plot
Nuevos recursos
四邉形 (四年級) 教師版
美國國旗 (Codex 版)
近似值:有效數字
拼砌四邊形
兩組對邊相等的四邊形
Descubrir recursos
公切線長度的計算
正三角形
指数函数的副本
[洋葱] 根据图象求参数取值范围-上(0118)
【2020高考】全国1卷(理科) 第18题
Descubre temas
Homotecia
Ecuaciones Cuadráticas
Intersección
Diagramas de árbol
Números Racionales