Google Classroom
Google Classroom
GeoGebra
GeoGebra Classroom
Abrir sesión
Buscar
Google Classroom
Google Classroom
GeoGebra
GeoGebra Classroom
Esquema
S.2 Ch.7 Simple Statistical Graphs
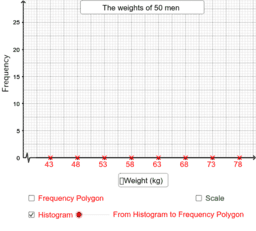
From Histograms to Frequency Polygons
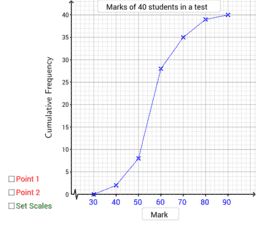
Cumulative Frequency Polygon
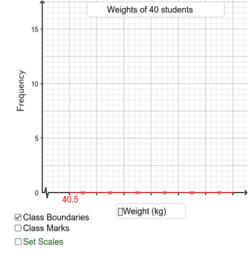
Drawing Histograms
S.2 Ch.7 Simple Statistical Graphs
Autor:
smcemath
,
Alexander Lau
From Histograms to Frequency Polygons
Cumulative Frequency Polygon
Drawing Histograms
Siguiente
From Histograms to Frequency Polygons
Nuevos recursos
Rose Curve
¿Quién llegará más lejos en el mundial?
Trefoil Knot
רישום חופשי
Model sferyczny - dwunastościan-dwudziestościan
Descubrir recursos
Graphing Equation
Properties of Parallelograms
สำรวจ1
Euclid I-12. (pg 10)
Quad + triple
Descubre temas
Integral Indefinida
Transformaciones Geométricas
Continuidad
Sucesiones y Series
Construcciones