Google Classroom
Google Classroom
GeoGebra
GeoGebra Classroom
Abrir sesión
Buscar
Google Classroom
Google Classroom
GeoGebra
GeoGebra Classroom
Esquema
Statistics
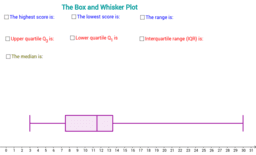
Box Plot
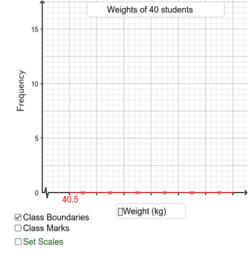
Drawing Histograms
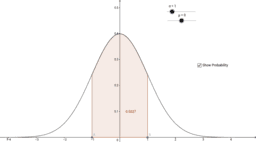
Altering the standard deviation and mean of the normal curve
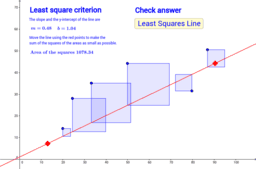
Least Squares Criterion
Statistics
Autor:
Dr. Edgar
Box Plot
Drawing Histograms
Altering the standard deviation and mean of the normal curve
Least Squares Criterion
Siguiente
Box Plot
Nuevos recursos
z`]]
Publish app "Public" test
Slope Between 2 Points (Phase 2)
רישום חופשי
Nikmati Keunggulan Di Bandar Judi Terpercaya
Descubrir recursos
Quadrilaterals
Plane Projection
Finding the height.
MODUL 16B_YANI NURCAHYANI_SMPN 2 SUKABUMI
Logo Sun Microsystems
Descubre temas
Diagramas
Gráfico Circular
Razones
Vectores
Diagramas de árbol