Google Classroom
Google Classroom
GeoGebra
GeoGebra Classroom
Sign in
Search
Google Classroom
Google Classroom
GeoGebra
GeoGebra Classroom
Outline
Estatística
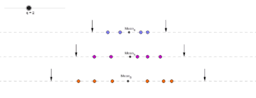
Statistical Outliers Impossible in Small Samples
Outlier Influence
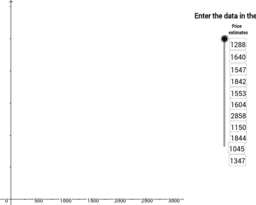
Estimate using Box Plot
Outliers
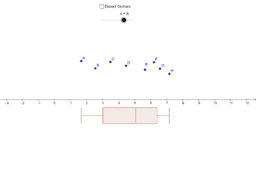
Dynamic Boxplot
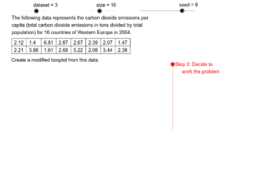
Step Through Modified Boxplot Construction
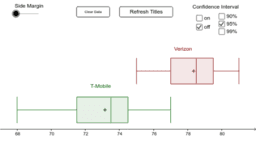
Generate Two Boxplots
Boxplot Game
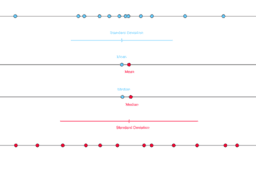
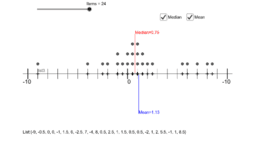
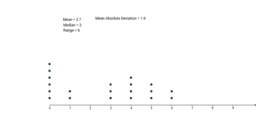
Mean, Median, and Standard Deviation
Dot Plot Interactive
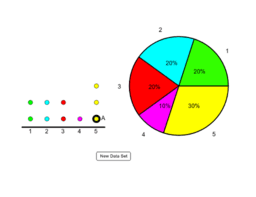
AQR Section 16: Creating a Pie Chart From a Dot Plot
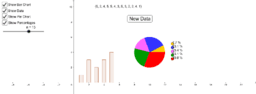
Bar Charts and Pie Charts
Dot Plot Tool
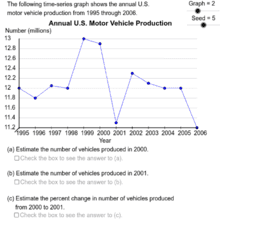
Time Series Analysis Problems
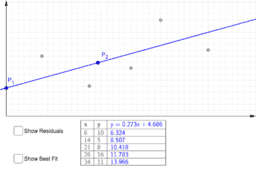
Least Squares Demonstration
Estatística
Author:
Palmerim
Statistical Outliers Impossible in Small Samples
Outlier Influence
Estimate using Box Plot
Outliers
Dynamic Boxplot
Step Through Modified Boxplot Construction
Generate Two Boxplots
Boxplot Game
Mean, Median, and Standard Deviation
Dot Plot Interactive
AQR Section 16: Creating a Pie Chart From a Dot Plot
Bar Charts and Pie Charts
Dot Plot Tool
Time Series Analysis Problems
Least Squares Demonstration
Next
Statistical Outliers Impossible in Small Samples
New Resources
Icosaedro
Pitágoras DL
coneana
CUBO
cubo dividido por hexágono
Discover Resources
tetraedro14
Sistema linear de duas variáveis
Produto misto
Pipas - Déia
Genius numérico
Discover Topics
Area
Similar Triangles
Circle
Real Numbers
Integral Calculus