Google Classroom
Google Classroom
GeoGebra
GeoGebra Classroom
Anmelden
Suche
Google Classroom
Google Classroom
GeoGebra
GeoGebra Classroom
Kapitel
Quadratics
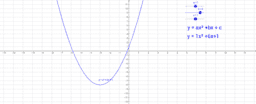
Graph y=x^2 + c
Quadratics
Autor:
Jean Maxstadt
Explore how the values of a, b, and c affect the graph.
Graph y=x^2 + c
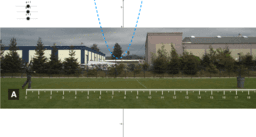
Ball in Can - Photo A
Explore how the values of a, b and c affect quadratic graph
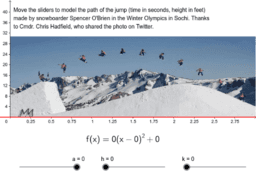
Olympic Quadratic Modeling with Sliders
Weiter
Ball in Can - Photo A
Neue Materialien
Angle Addition: Warm Up Exercises
Hyperbolic Paraboloid
Slope and Road Signs
အခြေခံ data အခေါ်အဝေါ်များ
Model sferyczny - sześcian-ośmiościan
Entdecke Materialien
melukis garis berat
Pedal Triangles of Isogonal Conjugates
testo in posizione2
keatonpart2
קטע אמצעים בטרפז 1
Entdecke weitere Themen
Bruchrechnen oder Brüche
Ähnlichkeitstransformation oder Ähnlichkeitsabbildung oder Ähnlichkeit
Zinsrechnung
KGV und GGT
Division