Google Classroom
Google Classroom
GeoGebra
GeoGebra Classroom
Anmelden
Suche
Google Classroom
Google Classroom
GeoGebra
GeoGebra Classroom
Kapitel
Handling Data
Probability
Graphs
Averages
Handling Data
Autor:
HHAMaths
Inhaltsverzeichnis
Probability
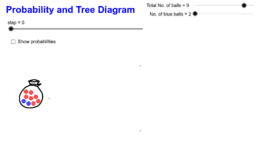
Probability and Tree Diagram
Conditional Probabilities and Independence
Experimental Probability Spinner
Copie de Probability and Tree Diagram
Graphs
Distance Time Graphs
Bar Charts and Pie Charts
Cumulative Frequency Properties
Scatter Graph
Averages
Box-and-Whisker Plot Generator
Mean Median
Weiter
Probability and Tree Diagram
Neue Materialien
גיליון אלקטרוני להעלאת נתוני בעיה ויצירת גרף בהתאם
Fourier Lissajous (Mechanical)
Angle Addition: Warm Up Exercises
Trefoil Knot
Damped Trochoidal Curve
Entdecke Materialien
Working with Revolutions
Minkowski Pythag Theorem Proof Color 2
Tangents to Circle
Special points and lines in a triangle
Writing and Solving Two-Step Expressions
Entdecke weitere Themen
Lineare Gleichungen
Symmetrie
Quadratische Gleichungen
KGV und GGT
Quadrat