Google Classroom
Google Classroom
GeoGebra
GeoGebra Classroom
Abrir sesión
Buscar
Google Classroom
Google Classroom
GeoGebra
GeoGebra Classroom
Esquema
Gráficos
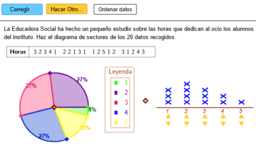
Diagramas de Sectores. Datos cualitativos/discretos
Gráficos
Autor:
Jorge Ramón Zarco Laveaga
Diagramas de Sectores. Datos cualitativos/discretos
Siguiente
Diagramas de Sectores. Datos cualitativos/discretos
Nuevos recursos
Funciones en un intervalo [a, b]
Cuadrilátero cíclico imprevisto
El triángulo Circuntangencial
Hay muchas formas de medir
Cuadrivértice ortocéntrico
Descubrir recursos
Peso manzanas
Construcción 21
Derivada de f(x)=kx^n
guía 5
Máximos y Mínimos
Descubre temas
Números
Pirámide
Adición
Fractales
Vectores