Google Classroom
Google Classroom
GeoGebra
Tarefa
Entrar no sistema
Pesquisar
Google Classroom
Google Classroom
GeoGebra
Tarefa
Esboço
AP Stats
AQR Section 17: Calculating Summary Statistics
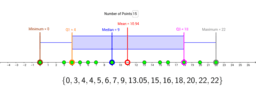
AQR Section 16: Five Number Summary Exploration
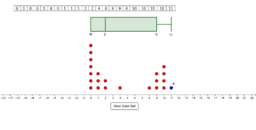
AQR Section 17: Dot Plot and Box-and-Whisker Plot
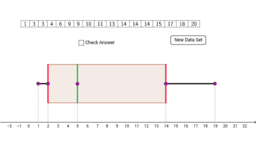
AQR Section 17: Creating a Box and Whisker Plot
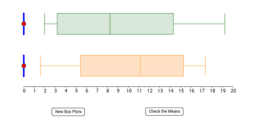
AQR Section 17: Where's the Mean?
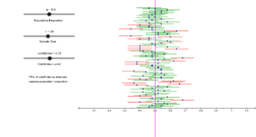
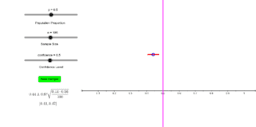
Confidence Interval for a Proportion
Exploring a Single Confidence Interval for a Proportion
AP Stats
Autor:
Steve Phelps
AQR Section 17: Calculating Summary Statistics
AQR Section 16: Five Number Summary Exploration
AQR Section 17: Dot Plot and Box-and-Whisker Plot
AQR Section 17: Creating a Box and Whisker Plot
AQR Section 17: Where's the Mean?
Confidence Interval for a Proportion
Exploring a Single Confidence Interval for a Proportion
Próximo
AQR Section 17: Calculating Summary Statistics
Novos Materiais
seo tool
အခြေခံ data အခေါ်အဝေါ်များ
Some random function
Hyperbolic Paraboloid
Model sferyczny - dwunastościan-dwudziestościan
Descobrir recursos
Circles
Week 10 - Reflection 1
setvisible
Dodecahedron coloring
ufa day 22
אניליטית קיץ 2013
Explorar Tópicos
Probabilidade Condicional
Pitágoras ou o Teorema de Pitágoras
Transformações Geométricas
Retas
Volume