Google Classroom
Google Classroom
GeoGebra
GeoGebra Klaslokaal
Aanmelden
Zoek
Google Classroom
Google Classroom
GeoGebra
GeoGebra Klaslokaal
Overzicht
statistics
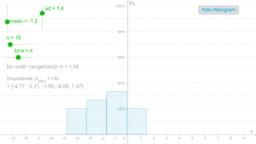
histograms
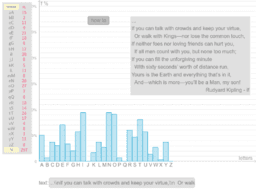
distribution of letters
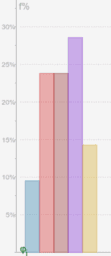
pie chart
Practicing Statistical Calculation-1
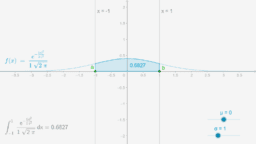
the bell curve
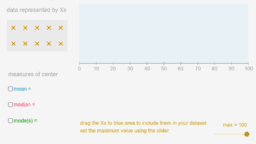
measures of center
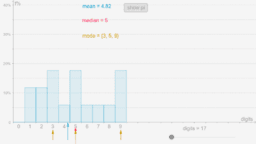
pi digits
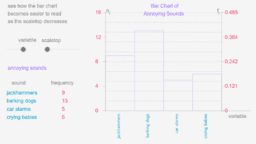
frequency scale
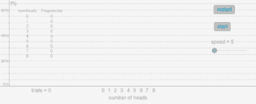
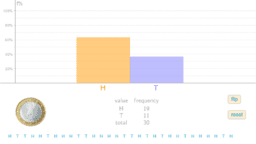
coin flipping-1
flipping a coin
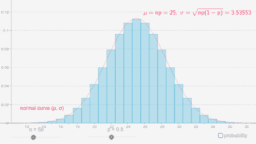
binomial and normal
random data-1
random data-2
coin tossing simulation
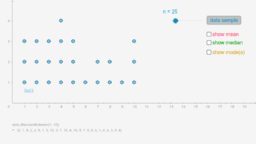
dotplot
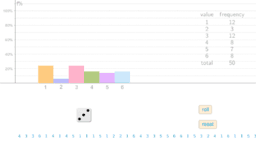
rolling a dice
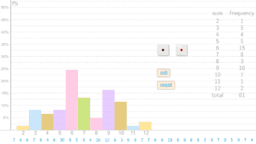
rolling two dice
statistics
Auteur:
Seddoh Marianne
,
sonom
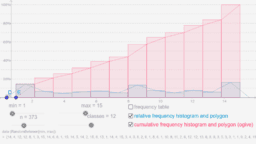
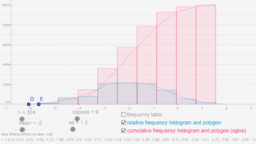
histograms
distribution of letters
pie chart
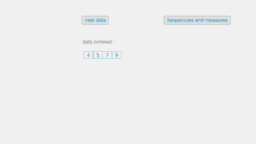
Practicing Statistical Calculation-1
the bell curve
measures of center
pi digits
frequency scale
coin flipping-1
flipping a coin
binomial and normal
random data-1
random data-2
coin tossing simulation
dotplot
rolling a dice
rolling two dice
Volgende
histograms
Nieuw didactisch materiaal
Some random function
bewijs stelling van Pythagoras
Untitled
Nikmati Keunggulan Di Bandar Judi Terpercaya
רישום חופשי
Ontdek materiaal
mediaan
Tilnærmelse af pi
KEDUDUKAN DUA LINGKARAN
Sum of Sines
กราฟเส้นตรง
Ontdek onderwerpen
Natuurlijke getallen
Hellingsfunctie
Vlakken
Kwadratische functies
Exponent