Google Classroom
Google Classroom
GeoGebra
Tarefa
Entrar no sistema
Pesquisar
Google Classroom
Google Classroom
GeoGebra
Tarefa
Esboço
Algebra 1
Statistics
Solving Linear Functions and Inequalities
Graphing Linear Functions
Writing Linear Functions
Algebra 1
Autor:
N.Andringa
,
Thomas Gebbie
Tópico:
Álgebra
Lista de conteúdos
Statistics
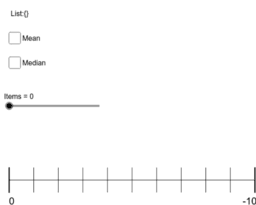
Dot Plot Generator
Box and Whisker Practice #2
Compare Box and Whisker Plots
Solving Linear Functions and Inequalities
Algebraic Proof Justification 1
Algebraic Proof Justification 2
Literal Equations Proof Justification
Graphing Linear Functions
Investigate the relationship between the three forms of line
First, use the sliders to create the parent function, y = x.
DIGI203-3D #8
Writing Linear Functions
Point Slope Form Matching
Slope Intercept Form Matching
Equivalent Linear Equations Matching
Próximo
Dot Plot Generator
Novos Materiais
apec
Model sferyczny - dwunastościan-dwudziestościan
z`]]
רישום חופשי
¿Quién llegará más lejos en el mundial?
Descobrir recursos
funz_esempio
Loc Geometric: Axa Radicală.
Pythagorean Puzzle
Construction 11
Angle Side Side
Modul 6B_Rahmawati_SMAN 03 Bombana
Explorar Tópicos
Simetria
Pirâmide
Centroide ou baricentro
Raiz
Reais