Anmelden
Suche
Kapitel
Stats
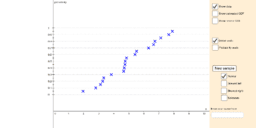
Normal probability plot
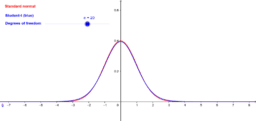
Comparison of the Student-t and Standard Nomal Distributions
Stats
Autor:
ArmHacker
Normal probability plot
Comparison of the Student-t and Standard Nomal Distributions
Weiter
Normal probability plot
Neue Materialien
Nikmati Keunggulan Di Bandar Judi Terpercaya
Random Polar Curve (3)
Untitled
Cartesian vs Polar
רישום חופשי
Entdecke Materialien
Angle Angle Triangle Similarity Model
GeoGebra Handbook problem 4.5
Pappus' Theorem
Parallelograms 3
New Geogebra Construction
Entdecke weitere Themen
Bruchrechnen oder Brüche
Pyramide
Differentialgleichungen
Kegel
Trigonometrische Funktionen oder Winkelfunktionen