Google Classroom
Google Classroom
GeoGebra
GeoGebra Classroom
Sign in
Search
Google Classroom
Google Classroom
GeoGebra
GeoGebra Classroom
Outline
Contour Plots
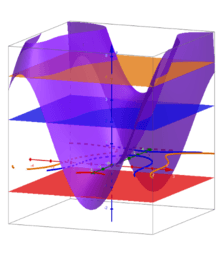
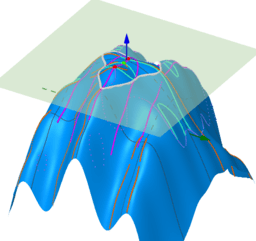
Contour plot and surface
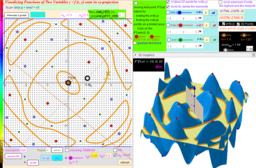
Function of several variables: several level curves
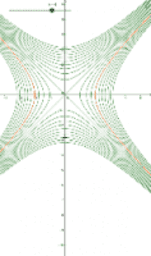
sin(x*y)+sin(x^2+y^2)- Images to Visualizing Functions of Two Variables
Visualizing Functions of Two Variables. Version 3
Contour Plots
Author:
Edward Wicks
Contour plot and surface
Function of several variables: several level curves
sin(x*y)+sin(x^2+y^2)- Images to Visualizing Functions of Two Variables
Visualizing Functions of Two Variables. Version 3
Next
Contour plot and surface
New Resources
Some random function
רישום חופשי
Angle Addition: Warm Up Exercises
Nikmati Keunggulan Di Bandar Judi Terpercaya
အခြေခံ data အခေါ်အဝေါ်များ
Discover Resources
I nailed it Mr. Nelson #11
L1_01
Spotty circle triangles 18 spot
Solid of revolution around the x-axis
Cobb-Douglas Function Surface
Discover Topics
Arithmetic
Natural Numbers
Unit Circle
Symmetry
Logarithm