Google Classroom
Google Classroom
GeoGebra
GeoGebra Classroom
Abrir sesión
Buscar
Google Classroom
Google Classroom
GeoGebra
GeoGebra Classroom
Esquema
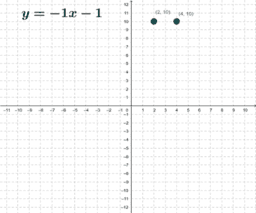
Graphing Lines y=mx+b
Graph the Line
Slope Intercept Form
Graphing Lines y=mx+b
Autor:
Brack Herald
Dragging a line to represent slope and y-intercept
Graph the Line
Slope Intercept Form
Siguiente
Graph the Line
Nuevos recursos
Viviani's Curve
Model sferyczny - sześcian-ośmiościan
bewijs stelling van Pythagoras
רישום חופשי
Model sferyczny - dwunastościan-dwudziestościan
Descubrir recursos
Vertical Lines
Rectangular prisms
ATC Triangle Centers
Binomial Coefficients
Solving Long Division Step by Step
Descubre temas
Triángulos Escalenos
Cálculo integral
Parábola
Sustracción
Operaciones Aritméticas