Google Classroom
Google Classroom
GeoGebra
GeoGebra Classroom
Anmelden
Suche
Google Classroom
Google Classroom
GeoGebra
GeoGebra Classroom
Kapitel
Demo
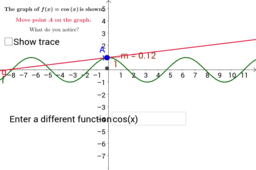
Visualize the graph of the derivative of a given function
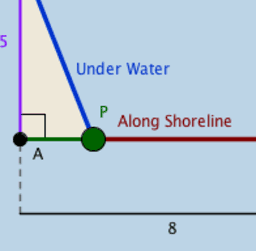
Oil Pipeline Optimization Problem
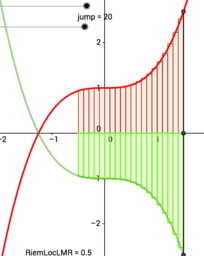
C0702 Volume Disk Method 3D Visual
Demo
Autor:
Miriam Ramirez
Visualize the graph of the derivative of a given function
Oil Pipeline Optimization Problem
C0702 Volume Disk Method 3D Visual
Weiter
Visualize the graph of the derivative of a given function
Neue Materialien
အခြေခံ data အခေါ်အဝေါ်များ
Model sferyczny - sześcian-ośmiościan
Hyperbolic Paraboloid
Fourier Lissajous (Mechanical)
Viviani's Curve
Entdecke Materialien
test
Graded Practice
centroid
拋物線平移
Hole 9
Entdecke weitere Themen
Bruchrechnen oder Brüche
Sinus
Mengenlehre
Kongruenz und Deckungsgleich
Volumen