Google Classroom
Google Classroom
GeoGebra
Classe GeoGebra
Se connecter
Chercher
Google Classroom
Google Classroom
GeoGebra
Classe GeoGebra
Contenu
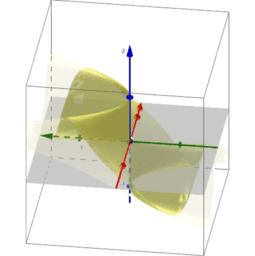
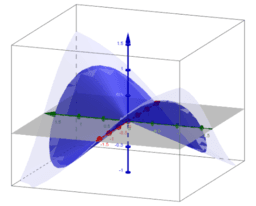
Visualization of limits of functions of two variables
Introduction
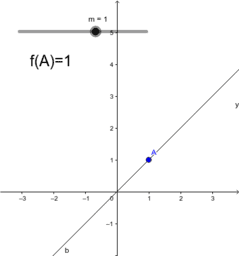
Example 1
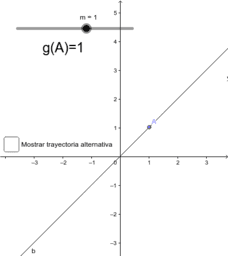
Example 2
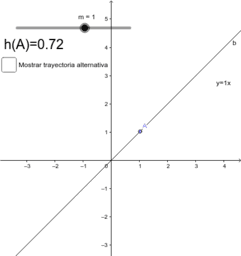
Example 3
Polar coordinates: Example 1
Polar coordinates: Example 2
Polar coordinates: Example 3
Thank you very much
Visualization of limits of functions of two variables
Auteur :
Laura del Río
Thème :
Fonctions
,
Limites
Presentation for sharing at the GeoGebra Global Gathering 2017
Introduction
Example 1
Example 2
Example 3
Polar coordinates: Example 1
Polar coordinates: Example 2
Polar coordinates: Example 3
Thank you very much
Suivant
Introduction
Nouvelles ressources
Cartesian vs Polar
Viviani's Curve
Slope Between 2 Points (Phase 2)
apec
Model sferyczny - sześcian-ośmiościan
Découvrir des ressources
project
Ribbon Activity
Chapter 4
GGB printing Videos
ANGLE SUM PROPERTY OF A TRIANGLE
Découvrir des Thèmes
Losange
Droites
Courbes Paramétriques
Rotation
Prisme