Google Classroom
Google Classroom
GeoGebra
GeoGebra Classroom
Abrir sesión
Buscar
Google Classroom
Google Classroom
GeoGebra
GeoGebra Classroom
Esquema
Statistics
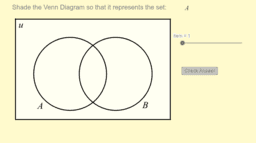
Sets and Venn Diagrams (2 Sets)
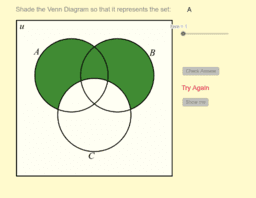
Venn Diagram (3 Sets)
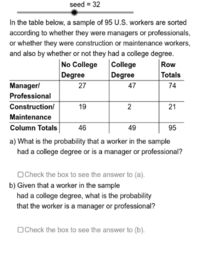
Computing Probabilities from Tables
Statistics
Autor:
Kevin Moore
Sets and Venn Diagrams (2 Sets)
Venn Diagram (3 Sets)
Computing Probabilities from Tables
Siguiente
Sets and Venn Diagrams (2 Sets)
Nuevos recursos
Random Polar Curve (3)
Viviani's Curve
רישום חופשי
bewijs stelling van Pythagoras
Rose Curve
Descubrir recursos
Taylor Polynomials
Moss Egg
day 80
Math Project
Hyperbolic - Sinh(ax)
Descubre temas
Secciones Cónicas
Funciones Polinómicas
Ecuaciones lineales
Variables Aleatorias
Sustracción