Google Classroom
Google Classroom
GeoGebra
GeoGebra Classroom
Anmelden
Suche
Google Classroom
Google Classroom
GeoGebra
GeoGebra Classroom
Kapitel
graphs (level 1)
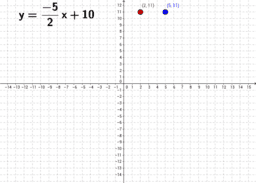
Slope Intercept / Standard Form
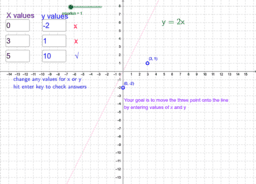
plot points
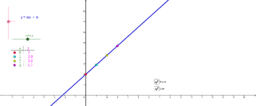
Linear Graph and Table
graphs (level 1)
Autor:
Steve Cheung
Slope Intercept / Standard Form
plot points
Linear Graph and Table
Weiter
Slope Intercept / Standard Form
Neue Materialien
Some random function
Angle Addition: Warm Up Exercises
Cartesian vs Polar
Nikmati Keunggulan Di Bandar Judi Terpercaya
အခြေခံ data အခေါ်အဝေါ်များ
Entdecke Materialien
Kevin Matamoros Triangulo #4
Estimating the Slope of a Tangent Line
Handshakes
Task 3
เส้นสมมาตร
Entdecke weitere Themen
Quadratische Funktionen
Funktionen
Parabel
Quader
Vektoren 3D (dreidimensional)