Google Classroom
Google Classroom
GeoGebra
Classe GeoGebra
Se connecter
Chercher
Google Classroom
Google Classroom
GeoGebra
Classe GeoGebra
Contenu
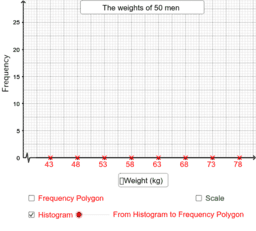
Simple Statistical Graphs
From Histograms to Frequency Polygons
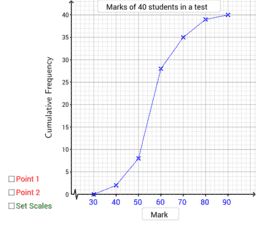
Cumulative Frequency Polygon
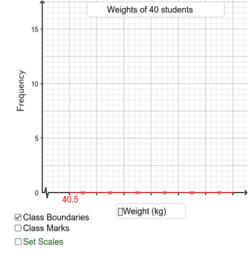
Drawing Histograms
Simple Statistical Graphs
Auteur :
Alexander Lau
From Histograms to Frequency Polygons
Cumulative Frequency Polygon
Drawing Histograms
Suivant
From Histograms to Frequency Polygons
Nouvelles ressources
z`]]
Trefoil Knot
Cartesian vs Polar
Slope and Road Signs
Viviani's Curve
Découvrir des ressources
rect
Writing Equations to Represent Tables 003
H Equilateral Triangle Const
welke formule hoort erbij?
Парабол интерактив хэрэглэгдэхүүн
Fungsi Kuadrat ^^
Reflection over y-axis Demonstration for Math 8
Découvrir des Thèmes
Rotation
Similitude
Entiers Naturels
Coordonnées
Sections Coniques