Google Classroom
Google Classroom
GeoGebra
GeoGebra Classroom
Sign in
Search
Google Classroom
Google Classroom
GeoGebra
GeoGebra Classroom
Outline
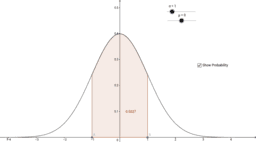
Standard Deviation Graphs
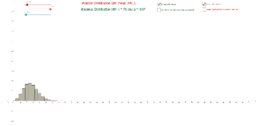
Poisson Distribution vs.Binomial Distribution
Altering the standard deviation and mean of the normal curve
Standard Deviation Graphs
Author:
John Snel
Topic:
Standard Deviation
Poisson Distribution vs.Binomial Distribution
Altering the standard deviation and mean of the normal curve
Next
Poisson Distribution vs.Binomial Distribution
New Resources
Angle Addition: Warm Up Exercises
רישום חופשי
z`]]
seo tool
גיליון אלקטרוני להעלאת נתוני בעיה ויצירת גרף בהתאם
Discover Resources
Coordinate: Nebraska N
Broken Spaghetti
Cross Section of a Cone Similarity
Modul 9G_YULIATI
Relation Between Exterior and Interior angles of a Triangle
Discover Topics
Functions
Fractions
Rotation
Pie Chart or Circle Chart
Rhombus