Lucky 7's
Overview
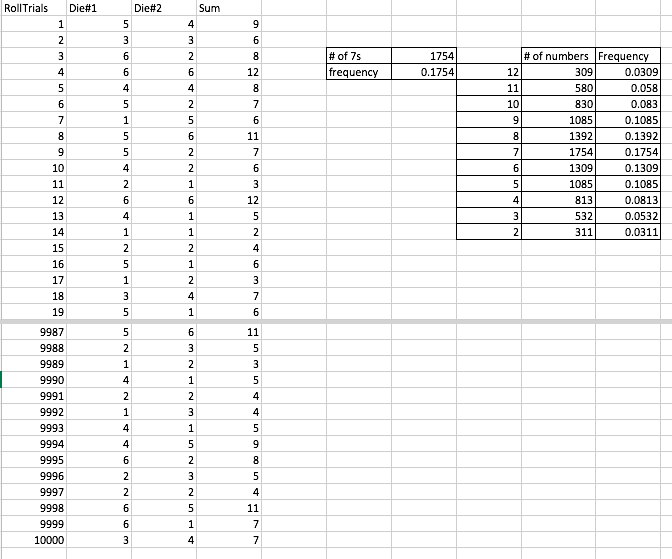
In this class, we asked the question "What is the chance of rolling a 7 with a two die?". Using excel, we could get 10,000 random cases and see what the chances really are. We used the function tools in excel to calculate these chances and really see how lucky the number 7 is.
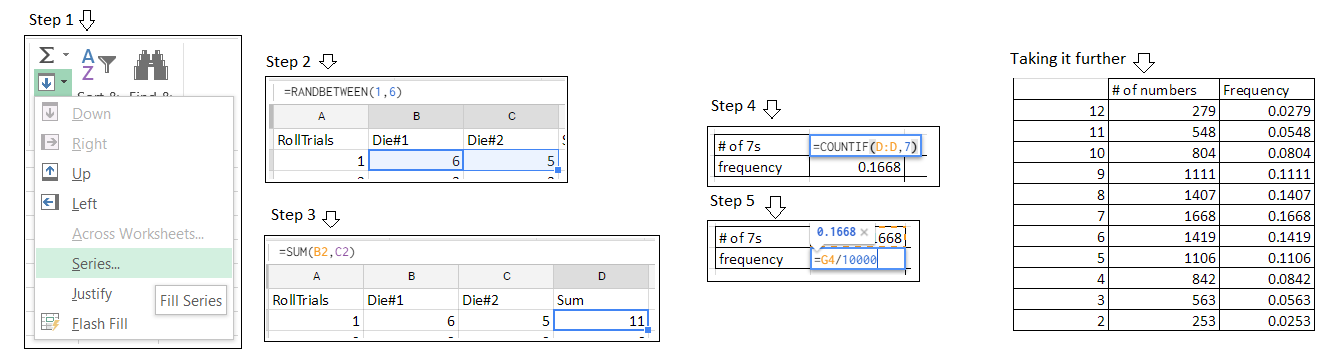
Step 1: As seen above, we got 10,000 random rolls for two die. We did this by writing the number 1 in box A2, then getting a series in the column from 1 to 10,000. This will fill the column up to 10,000.
Step 2: We then got two random "rolls" by using the function =randbetween and using 1 and 6 as the top and bottom.
Step 3: We then summed these two "rolls" together by using =sum and clicking B2 for the first and C2 for the second.
Step 4: After, we calculate the amount of 7's by using the function =countif and selecting the entire Sum column and then what number we want to find, which in this case would be 7.
Step 5: Then we wanted to find the frequency that a 7 would occur so we took the number of 7s that were in the sum column and divided it by 10,000.
To go a step further, I made a chart of the frequencies of all the numbers that could be summed together while rolling two die (2-12).
It turns out that rolling a 7 is not that lucky when comparing to the other possibilities that could be rolled.
Grade 7
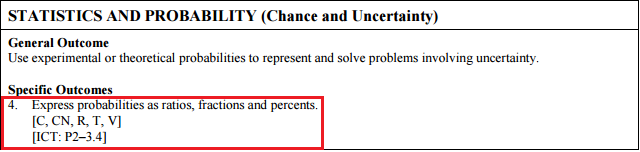
This fits in the grade 7 curriculum in Statistics and Probability (Chance and Uncertainty) specifically number 4. Students must look at the problem and give the chance of something occurring and express it in a variety of different forms.
Students are required to:
- Determine the probability of a given outcome occurring for a given probability experiment,and express it as a ratio, fraction and percent.
- Provide an example of an event with a probability of 0 or 0% (impossible) and an example of
an event with a probability of 1 or 100% (certain).
30-2
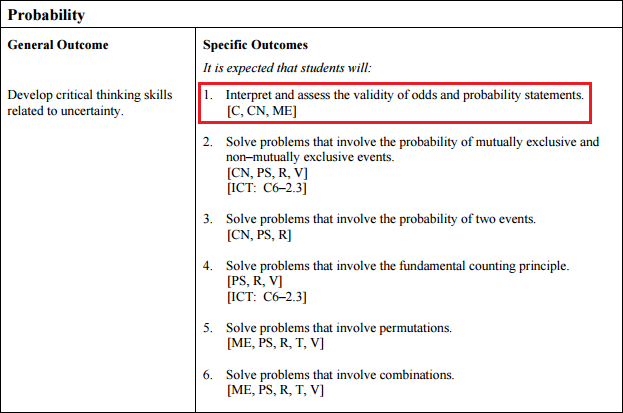
Also, this is in the 30-2 curriculum in Probability specific for number 1. Students must assess the probability of something happening in a particular statement.
- Provide examples of statements of probability and odds found in fields such as media,biology, sports, medicine, sociology and psychology.
- Explain, using examples, the relationship between odds (part-part) and probability (partwhole).
- Express odds as a probability and vice versa.
- Determine the probability of, or the odds for and against, an outcome in a situation.
- Explain, using examples, how decisions may be based on probability or odds and on
subjective judgments.
- Solve a contextual problem that involves odds or probability.
Sample Questions:
Grade 7:
The teacher could ask how often 5'0" occurs in their classroom. Students can enter the information into excel and calculate the amount of times it occurs using the formulas learned.
Grade 12:
In blackjack, two cards are flipped over and the chances of getting 21 from those two cards are slim. The teacher could get the students to do the same experiment as above and get the students to calculate the chance of 21 happening first try.
Conclusion
Finally, I really liked finding different things to do with excel. I never realized there was more to excel than I thought regarding the functions and different tools I did not know existed before this class. I will definitely bring more excel into my classroom as I see it as a useful tool for a variety of things.