Google Classroom
Google Classroom
GeoGebra
GeoGebra Classroom
Abrir sesión
Buscar
Google Classroom
Google Classroom
GeoGebra
GeoGebra Classroom
Esquema
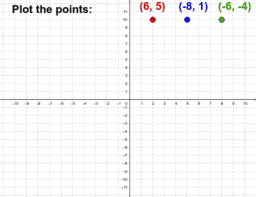
Plot 3 points
Plot Points
Plot 3 points
Autor:
kriffey
Plot Points
Siguiente
Plot Points
Nuevos recursos
Viviani's Curve
גיליון אלקטרוני להעלאת נתוני בעיה ויצירת גרף בהתאם
Random Polar Curve (3)
Fourier Lissajous (Mechanical)
Some random function
Descubrir recursos
UCSS Math I 2.7.2 Example 2
math H.W. 1
Makeup
trig graphs
Descubre temas
Límites
Triángulos Isósceles
Lógica
Ortocentro
Regresión Lineal