Olympic Data Presentation
Overview:
Our presentation was using fathom with data from the Summer Olympics up until 2012.We had to compare and contrast various different events and present the class our findings.
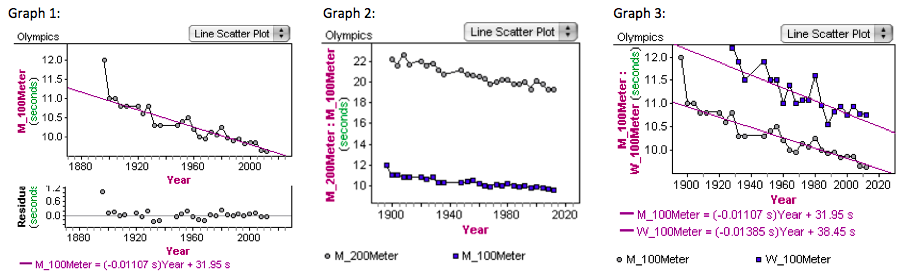
Graph 1: We compared mens 100m and time, using residuals as well. We found that when deleting and adding the outlier, it tilted the residual line slightly up.
Graph 2: We compared mens and womens 100m and time and found that the men and women improved at the same rate, but men were always faster.
Graph 3: We calculated the exact time that the women would be equal to the men and it was in year 2172 (which is actually an Olympic year!).
From top to bottom: Mens Long Jump, Womens Long Jump, Mens High Jump, Womens High Jump
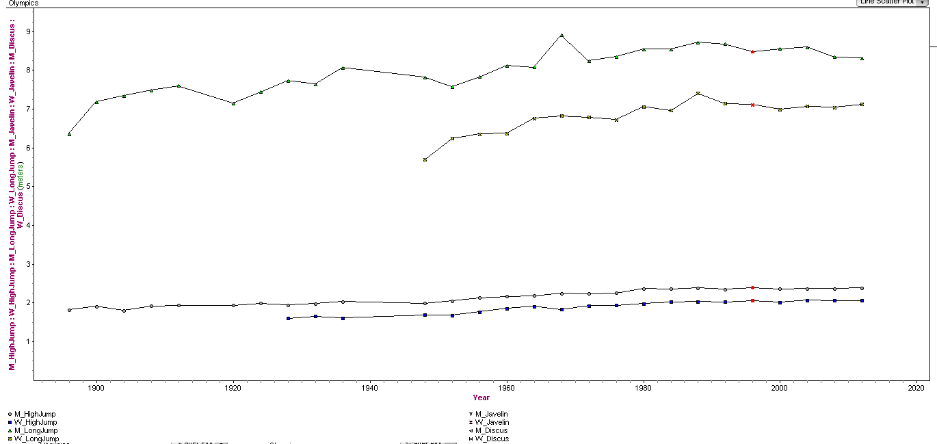
In the above graph, we see the comparisons between mens and womens long jump and high jump. We found that for long jump, the men and women were improving at the same rate but still a difference in height jumped where in high jump, the men were slightly better, but the women were just under. We found this information interesting because we always think of the men as being extremely better than the women, but in these cases that is not correct.
Mens and Womens Discus
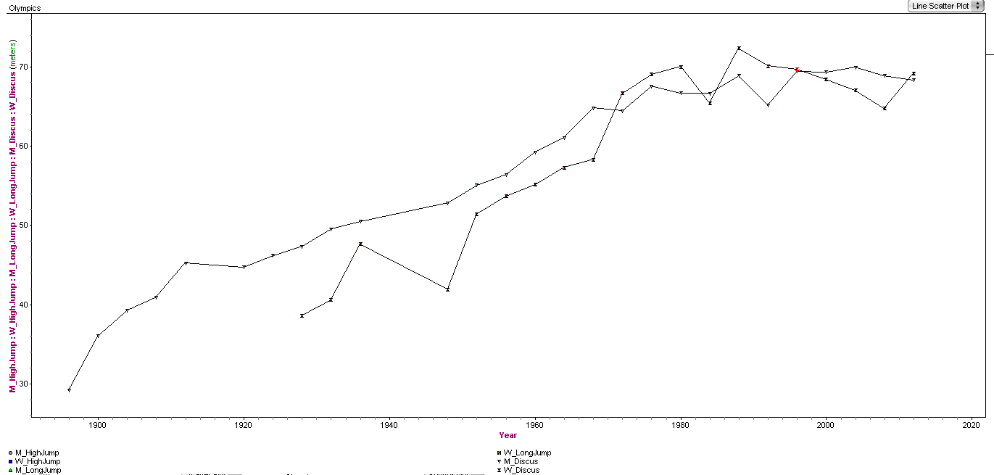
The information regarding mens and womens discus was the most interesting by far. The graph shows that the men and women both are extremely good and there is no one gender that is better than the other. One year the women will be better where in the next the men would be better. There is actually a year (highlighted red) that the distances are almost exactly the same in the same Olympic year. This shows that the gender of the contestants has no impact on the performance and results.
Grade 8
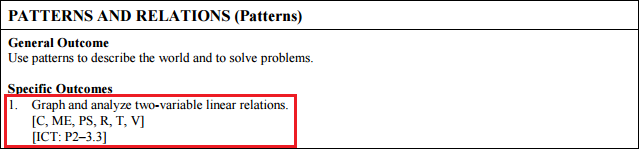
The curriculum in grade 8 Patterns and Relations (Patterns) specifically number 1 relates perfectly. The students have to graph the data and analyze the graph of the linear relations.
Students will have to:
- Determine the missing value in an ordered pair for a given equation.- Create a table of values by substituting values for a variable in the equation of a given linear
relation.
- Construct a graph from the equation of a given linear relation (limited to discrete data).
- Describe the relationship between the variables of a given graph.
Grade 9
Also grade 9 Patterns and Relations (Patterns) applies to the curriculum specifically to number 2. Students must graph the data, analyze what they are seeing, and then get information from the graph to solve problems.
Students are required to:
- Describe the pattern found in a given graph.
- Graph a given linear relation, including horizontal and vertical lines.
- Match given equations of linear relations with their corresponding graphs.
- Extend a given graph (extrapolate) to determine the value of an unknown element.
- Interpolate the approximate value of one variable on a given graph, given the value of the other
variable.
- Extrapolate the approximate value of one variable from a given graph, given the value of the
other variable.
- Solve a given problem by graphing a linear relation and analyzing the graph.
Sample Questions:
Grade 8:
Ask the students to describe what they are seeing and the differences between males and females in each of the graphs above.
Grade 9:
Ask the students to extend the graph and see where the men and women will be equal in different comparisons and see "why" this happens or if it is physically possible for them to be equal at that point (ex. physical limitations, in the negatives, etc)
Conclusion:
I really liked using fathom for this discovery learning activity. I think that students would benefit from this because the information is given to them and they have to work with it and manipulate it so they can make conjectures about certain scenarios. I think that students in middle school would be technologically advanced enough to work effectively with the program and it fits properly in the curriculum.