Google Classroom
Google Classroom
GeoGebra
GeoGebra Classroom
Sign in
Search
Google Classroom
Google Classroom
GeoGebra
GeoGebra Classroom
Outline
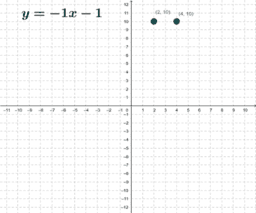
Graphing Lines y=mx+b
Graph the Line
Slope Intercept Form
Graphing Lines y=mx+b
Author:
Szotákné Tóth Márta
,
Brack Herald
Dragging a line to represent slope and y-intercept
Graph the Line
Slope Intercept Form
Next
Graph the Line
New Resources
Some random function
Viviani's Curve
Angle Addition: Warm Up Exercises
Damped Trochoidal Curve
רישום חופשי
Discover Resources
Skew Lines and Line of Shortest Distance
Infinite Chocolate
Bunglon
مستقيم
Symmetrigruppa til en likesidet trekant
Discover Topics
Trigonometry
Algebra
Cosine
Calculus
Incircle or Inscribed Circle