


Visualizing Data Using Dot Plots
Visualizing Data Using Dot Plots
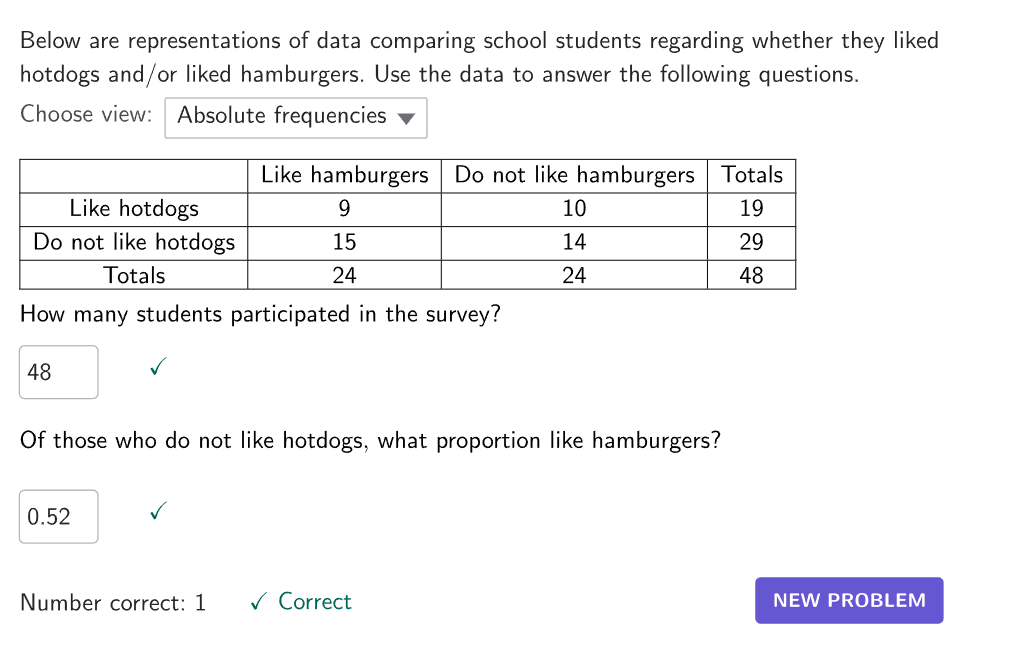
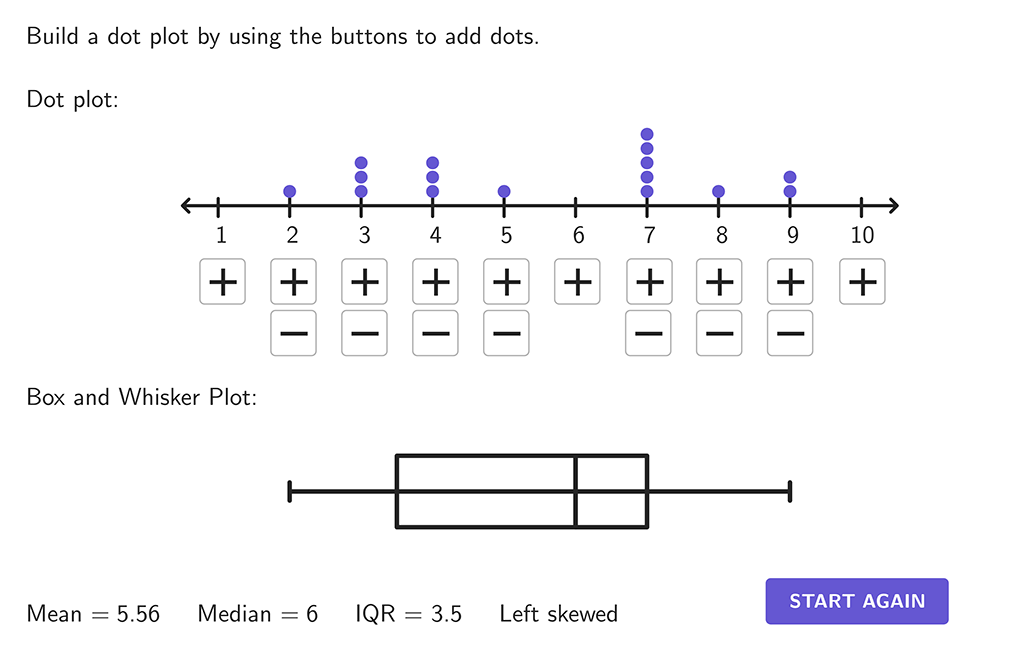
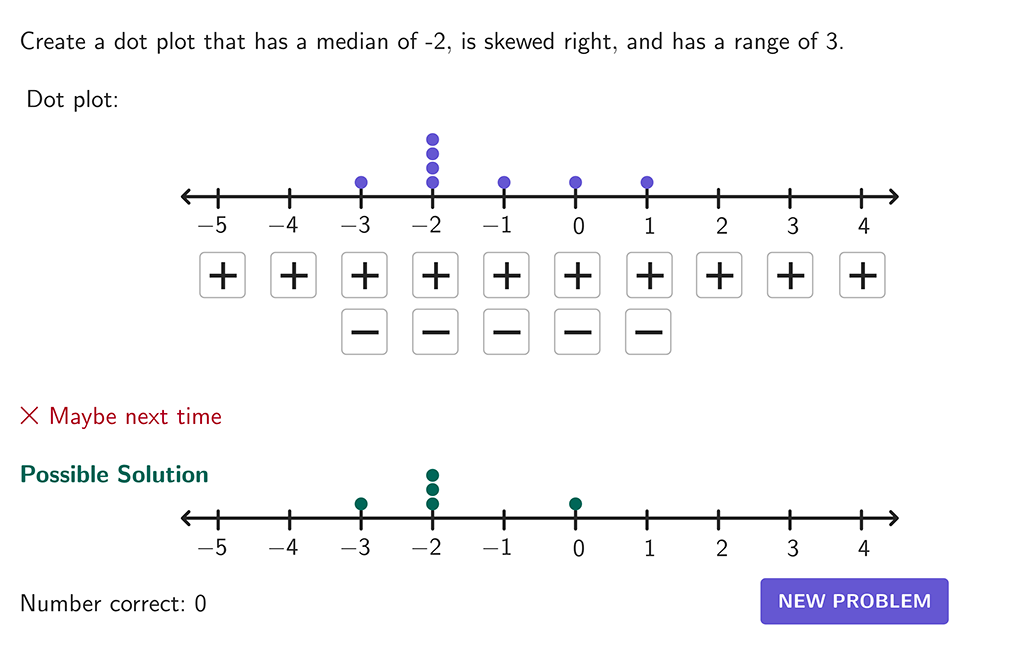
Explore representations of data from interviews in dot plots, tables, and associated values in this activity.

Putting It All Together
Answer these open ended questions on your own or with others to form deeper math connections.
Open-ended question 1
How is the value of determined?
Text and math input
Open-ended question 2
What is meant by "attribute"?
Text and math input
Open-ended question 3
Write an original question you could ask your class. What is , the attribute, and the unit of measurement?
Text and math input