Google Classroom
Google Classroom
GeoGebra
Classe GeoGebra
Se connecter
Chercher
Google Classroom
Google Classroom
GeoGebra
Classe GeoGebra
Contenu
Pearson Maths A level Stats & Mechanics 1
Representations of data
Correlation
Statistical distributions
Hypothesis testing
Constant acceleration
Variable acceleration
Pearson Maths A level Stats & Mechanics 1
Auteur :
Nicholas Jackson
,
Pearson Secondary Maths
A set of activities designed to be used in conjunction with exercises from Edexcel AS and A level Mathematics: Statistics & Mechanics Year 1/AS
Table des matières
Representations of data
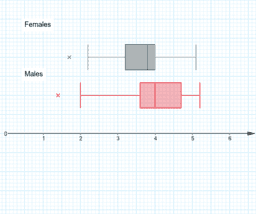
Box plots: page 44, example 3
Correlation
Correlation: page 64, example 3
Statistical distributions
Statistical distributions: page 93, example 7
Hypothesis testing
Hypothesis testing: page 103, example 4
Constant acceleration
Constant acceleration: page 134, example 3
Variable acceleration
Variable acceleration: page 183, example 3
Suivant
Box plots: page 44, example 3
Nouvelles ressources
Trefoil Knot
apec
bewijs stelling van Pythagoras
Untitled
Viviani's Curve
Découvrir des ressources
Incentro
Algebra of Integrals
Trigonometric ratio - two legs
spots
Höhenlinien und Gradientenfeld
Damon_TestingSimiliarityTheoremsHW
Découvrir des Thèmes
Périmètre
Trigonometrie
Diagrammes
Équations Linéaires
Probabilité