Google Classroom
Google Classroom
GeoGebra
GeoGebra Classroom
Log ind
Søg
Google Classroom
Google Classroom
GeoGebra
GeoGebra Classroom
Opsummering
Grafieken van tweedegraadsfuncties
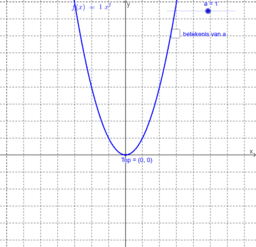
Grafiek van f(x)=ax²
Grafiek van f(x)=a(x - p)²+q
Grafieken van tweedegraadsfuncties
Forfatter
Sabine Van Keer
Emne:
Funktioner
,
Funktionsgrafer
Invloed van de parameters op de grafiek van een tweedegraadsfunctie.
Indholdsfortegnelse
Grafiek van f(x)=ax²
Invloed van a
De waarde van a aflezen uit de grafiek
Grafiek van f(x)=a(x - p)²+q
Grafiek van functies f(x) = a (x-p)²
Grafiek van f(x)=ax²+q
Grafiek van functies f(x)=a(x-p)²+q
Næste
Invloed van a
Nye Materialer
Yusif ibn Kuseyir mausoleum - zijpaneel 1
Yusif ibn Kuseyir mausoleum - paneel boven ingang
twee figuren met dezelfde oppervlakte
Yusif ibn Kuseyir mausoleum - zijpaneel 2
symmetrie
Opdag Ressourcer
Oefeningen op machtsverheffing.
Transformaties sinus
Opgave 12
Het optellen van vectoren is associatief
inhoudsmaten en tabellen - decimale getallen
Udforsk emner
Rette linjer
Plane figurer eller former
Kube
Parabler
Kugle