How to plot strange attractors
Video tutorial:
Description
With the following GeoGebra script you can plot the numerical solution of systems of differential equations.
The main command used here is NSolveODE(). More info: https://wiki.geogebra.org/en/NSolveODE_Command
Other Auxiliary commands used are:
https://wiki.geogebra.org/en/Sequence_Command
https://wiki.geogebra.org/en/Point_Command
https://wiki.geogebra.org/en/Polyline_Command
The 3D graphics view must be opened!
GeoGebra script
##Parameters##
d = 10
b = 8/3
p = 28
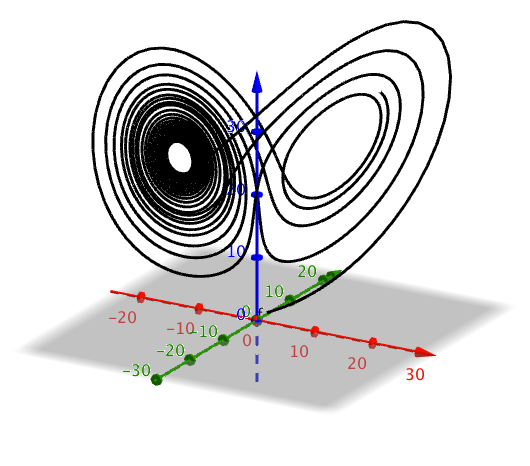
##System of differential equations: Lorenz attractor##
x'(t,x,y,z) = d * (y - x)
y'(t,x,y,z) = x * (p - z) - y
z'(t,x,y,z) = x * y - b * z
##Initial Condition##
x0 = 1
y0 = 1
z0 = 1
##Numerical solution##
NSolveODE({x', y', z'}, 0, {x0, y0, z0}, 20)
##Note##
# The command NSolveODE() creates three curves
# containing the numerical silution of the system
# per variable (x,y and z) and they are plotted
# against time in the 2D graphic view.
##Calculate length of solution 1##
len = Length(numericalIntegral1)
##Define points from the solution##
L_1 = Sequence( (y(Point(numericalIntegral1, i)), y(Point(numericalIntegral2, i)), y(Point(numericalIntegral3, i))), i, 0, 1, 1 / len )
##Draw curve##
f = Polyline(L_1)
##Finally, you need to hide numericalIntegra1, numericalIntegra2, numericalIntegra3, and L_1##
Result
Short tutorial in the GeoGebra suite app
If you like these tutorials, you can support my work in Patreon:
https://www.patreon.com/jcponce
∞ Thanks!