Voronoi diagram
This activity belongs to the GeoGebra book Voronoi Paintings.
Let's imagine that we mark two points in the plane. These points can represent real entities, such as water wells, supply stations, health centers, communication centers, urban centers, etc. To avoid possible confusion in the rest of the article, we will call each of these points a site.
We can ask ourselves what is the region of the plane whose points are closer to one site than to another. The answer is a half-plane, whose boundary is the perpendicular bisector between both sites.
Let's expand the number of sites to a collection of n sites. Take any site P from that collection. What will now be the region of the plane whose points are closer to P than to any other site in the collection? The answer is an intersection of half-planes. Proceeding in the same way for each of the sites, we obtain a division of the plane into n exclusive regions, called Voronoi regions. Thus, each Voronoi region is formed by all the points closest to each site in the given collection.
The boundary between two neighboring regions is a piece (segment or ray) of the perpendicular bisector between the sites of the collection corresponding to those two regions. The set of these segments and rays is called a Voronoi diagram (Figure 1). See, for example, [7, 15] for a basic introduction to this concept.
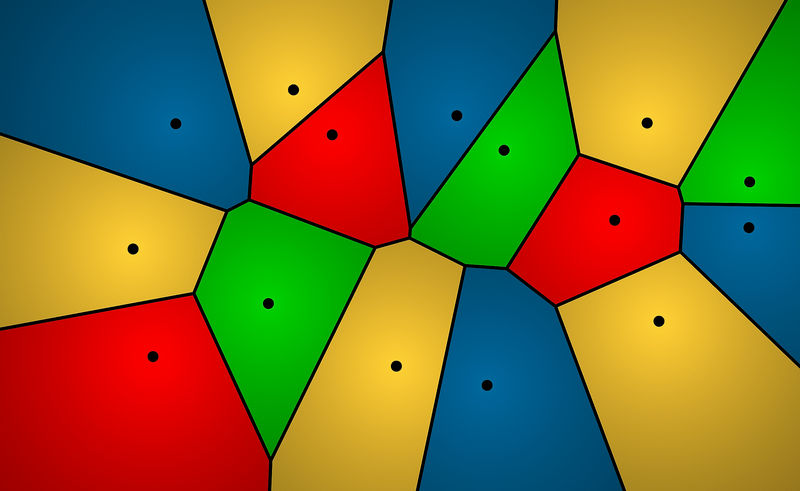
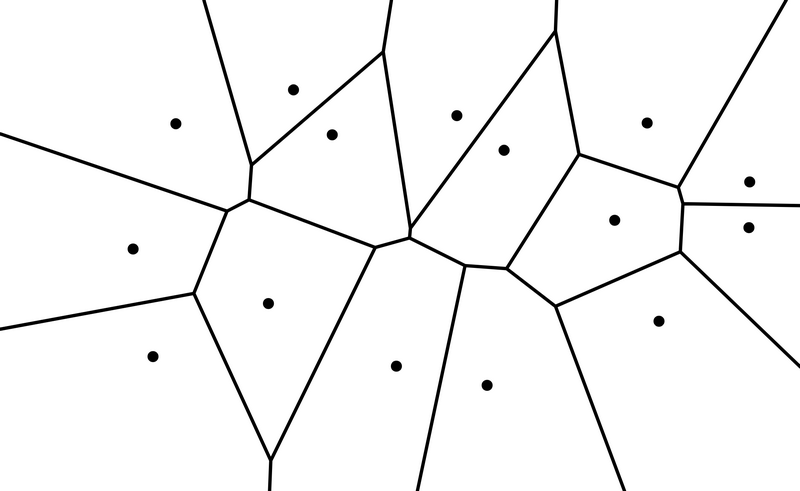
Figure 1: Regions and Voronoi diagram of a collection of 15 sites
Figure 1: Regions and Voronoi diagram of a collection of 15 sites