Google Classroom
Google Classroom
GeoGebra
Classe GeoGebra
Se connecter
Chercher
Google Classroom
Google Classroom
GeoGebra
Classe GeoGebra
Contenu
Algebra 2 - Lesson 6.3 Part 1
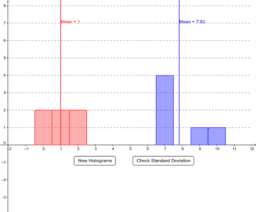
AQR Section 17: Which Histogram has more Variation?
AQR Section 17: Calculating Summary Statistics
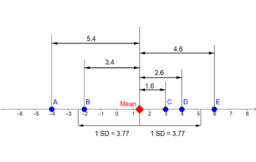
Standard Deviation Investigation
S1_Standard Deviation
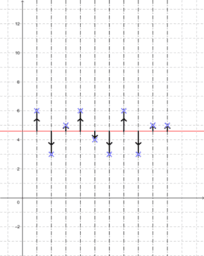
Visual Demo of Standard Deviation
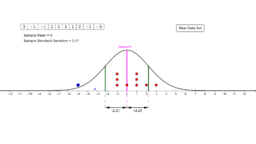
AQR Section 18: Sample Mean and Sample Standard Deviation
Algebra 2 - Lesson 6.3 Part 1
Auteur :
Jedi Algebron
Thème :
Algèbre
AQR Section 17: Which Histogram has more Variation?
AQR Section 17: Calculating Summary Statistics
Standard Deviation Investigation
S1_Standard Deviation
Visual Demo of Standard Deviation
AQR Section 18: Sample Mean and Sample Standard Deviation
Suivant
AQR Section 17: Which Histogram has more Variation?
Nouvelles ressources
အခြေခံ data အခေါ်အဝေါ်များ
גיליון אלקטרוני להעלאת נתוני בעיה ויצירת גרף בהתאם
bewijs stelling van Pythagoras
¿Quién llegará más lejos en el mundial?
Rose Curve
Découvrir des ressources
Fit Graph: Sinusoid_5, Horizontal Translations
constructing a parallel through a point, translated triangle
안전놀이터주소 \价 《YOYO 88 .COM 》 价\ぬgalloぬ안전한놀이터
log parameters
circular pattern 12c
The Fourier Transform
Découvrir des Thèmes
Intégrale Définie
Résumé Statistique
Variance
Soustraction
Triangles Equilatéraux