Google Classroom
Google Classroom
GeoGebra
GeoGebra Classroom
Sign in
Search
Google Classroom
Google Classroom
GeoGebra
GeoGebra Classroom
Outline
IB - Statistics
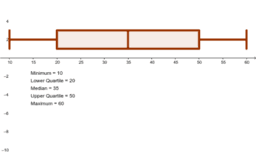
Describing the Distribution (with Box plots)
Box-and-Whisker Plot Generator
IB - Statistics
Author:
Steve Edgar
Topic:
Boxplot
,
Statistics
Describing the Distribution (with Box plots)
Box-and-Whisker Plot Generator
Next
Describing the Distribution (with Box plots)
New Resources
seo tool
Cartesian vs Polar
bewijs stelling van Pythagoras
Model sferyczny - dwunastościan-dwudziestościan
Untitled
Discover Resources
Tony's Test Geogebra Stuff
MG Nine-Point Circle
day 57 (2)
Inside the torus with a trefoil knot
Algeblocks Quadrant Mat
Discover Topics
Circumcircle or Circumscribed Circle
Ratios
Terms
Fractions
Volume