Visualizing Functions of Two Variables. Version 3
This Applet can be used to Visualizing Functions of Two Variables onto its xy-projection in the form of a heatmap.
The most important change compared with the previous version https://www.geogebra.org/m/qjvkbXxP is increasing the speed of execution of tasks.
Heatmap show the same color of intensity for all points (x,y) with the same value of f (x, y). In this applet for its graphical representation I use two different methods. The first method uses a direct numerical calculation of functions: f(x,y). The second method draw a two-dimensional plot of the contours lines.
Here are explored:
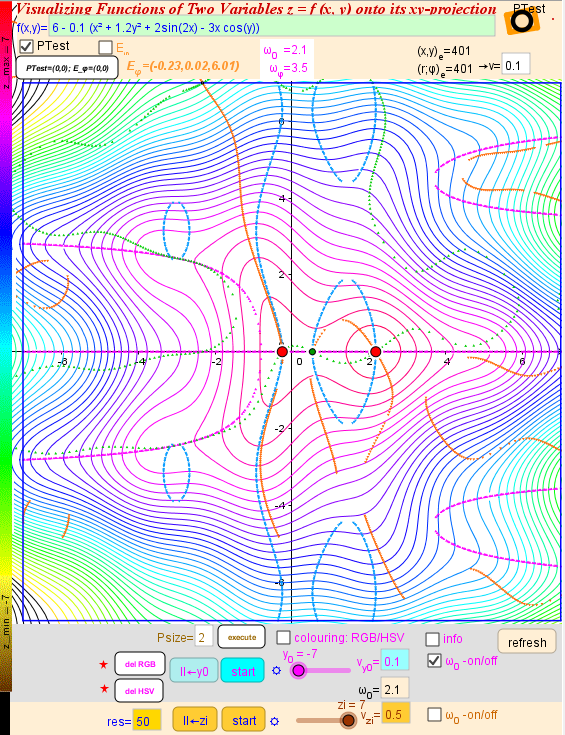
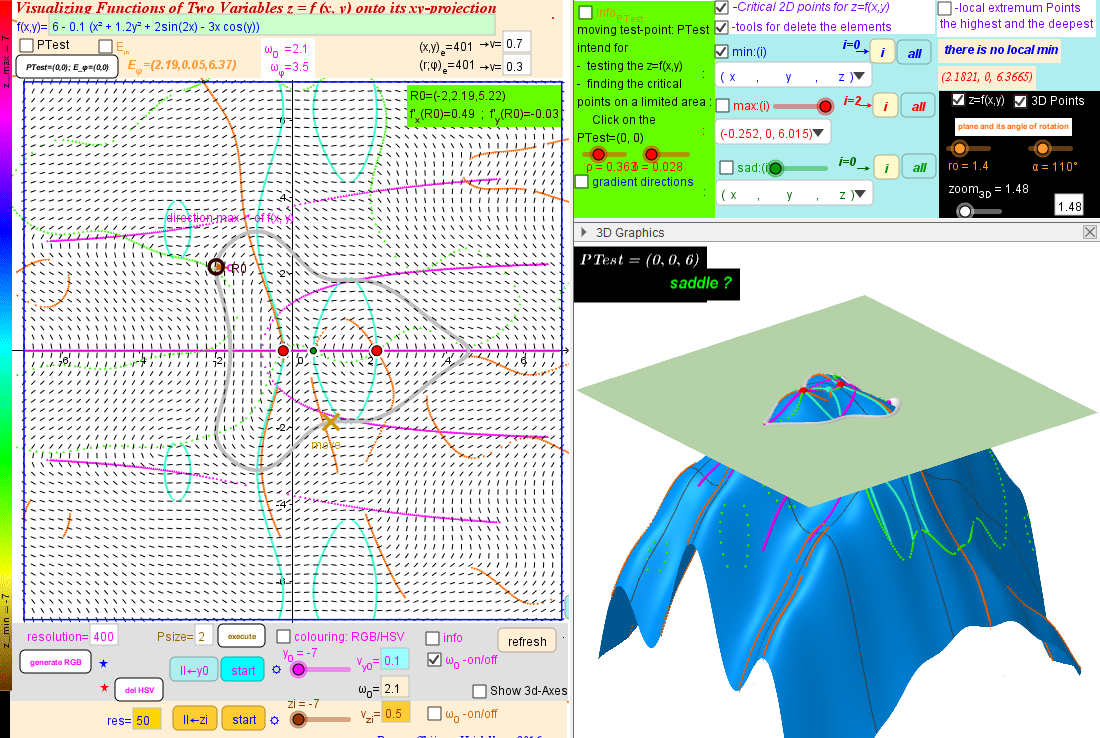
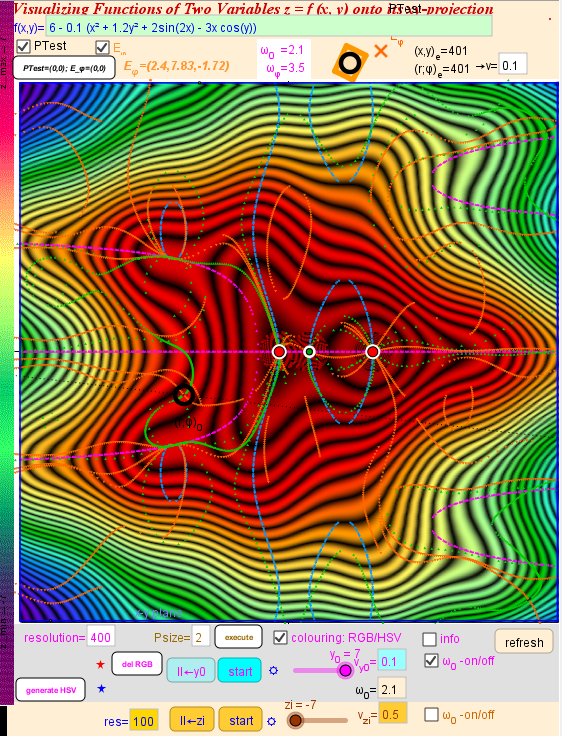
-Extrema lines. Points of intersection of these lines are critical points.
-Two methods of drawing contour lines:
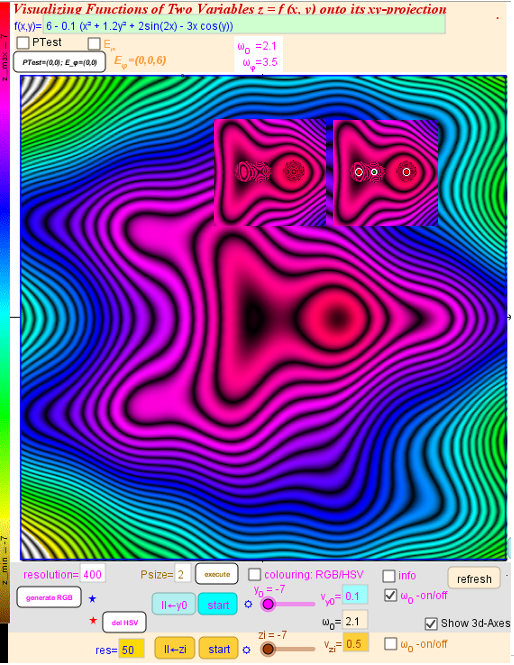
Scan method. In this case colours of painting are dependent on the heights with respect to the x-y Plane. Lines of the same color are contour lines -similar to the lines of equal thickness in Optical Interference. You can use the "Frequency" parameter to adjust the distance between the lines. Increasing the frequency, you can examine in more details the functions region with small changes of coordinates z.
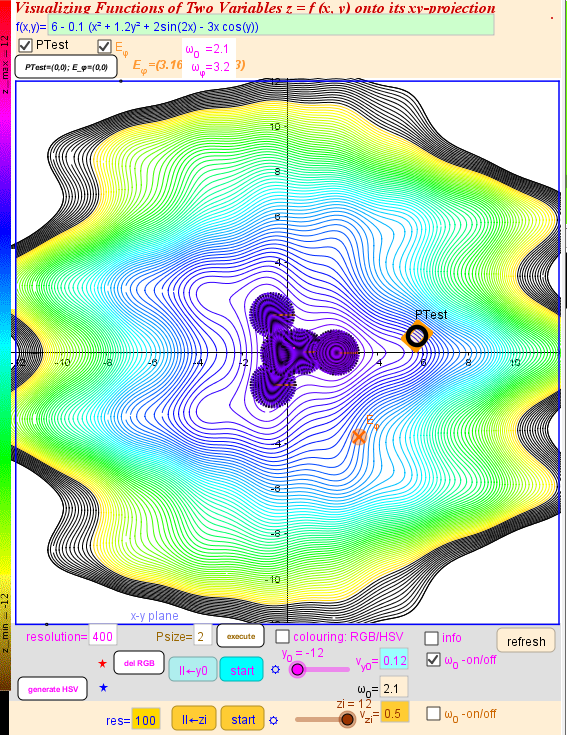
LevelCurve method. In this case contour graph is drawn directly on a x-y Plane.
Both methods can be used for all points in x-y Plane and for a small area near the selected point.
-Critical points of the function y=f(x,y) and its projection onto the x-y plane.
Attention:
You can download the applet to your computer and Java applet will run faster.
6 - 0.1 (x² + 1.2y² + 2sin(2x) - 3x cos(y))
1. Contour lines in x-y Plane: LevelCurve method
2. Contour lines in x-y Plane: LevelCurve method, Extrema lines
3. Slope Feld, level Curve, Critical Points, Extrema lines, 3D Surface
4. Contour lines in x-y Plane: Scan method ,RGB Colouring, Extrema lines
5. Contour lines in x-y Plane: Scan method , HSV Colouring