Google Classroom
Google Classroom
GeoGebra
GeoGebra Classroom
Anmelden
Suche
Google Classroom
Google Classroom
GeoGebra
GeoGebra Classroom
Kapitel
AP Stats
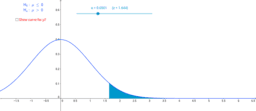
Power and Error Rates for a z-Based Hypothesis Test
AP Stats
Autor:
Paula Torres
Power and Error Rates for a z-Based Hypothesis Test
Weiter
Power and Error Rates for a z-Based Hypothesis Test
Neue Materialien
Cartesian vs Polar
seo tool
Fourier Lissajous (Mechanical)
Nikmati Keunggulan Di Bandar Judi Terpercaya
apec
Entdecke Materialien
Kaleidoscope
Parts of an ellipse.
Bola Dalam Tabung
G-CO.12 Construction #6 Perpendicular bisector of a line segment
LTFMSVD01
Entdecke weitere Themen
Histogramm
Mittelwerte
Diagramme
Koordinaten
Mengenlehre