Google Classroom
Google Classroom
GeoGebra
GeoGebra Classroom
Conectar
Buscar
Google Classroom
Google Classroom
GeoGebra
GeoGebra Classroom
Esquema
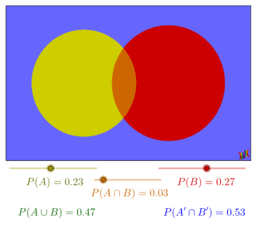
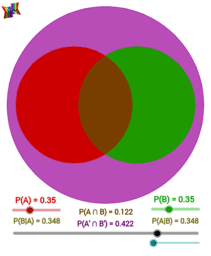
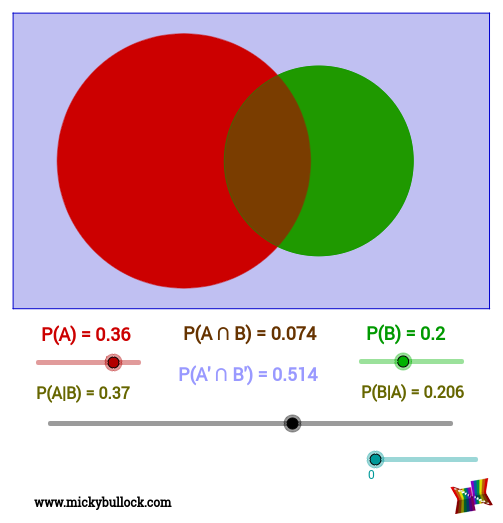
Probability Venn Diagrams
Probability Venn Diagram
Probability Venn Diagram: Circle
Probability Venn Diagram: Rectangle
Probability Venn Diagrams
Autor:
Micky Bullock
Tema(s):
Diagramas
,
Probabilidad
Probability Venn Diagram
Probability Venn Diagram: Circle
Probability Venn Diagram: Rectangle
Siguiente
Probability Venn Diagram
Nuevos recursos
Slope and Road Signs
Model sferyczny - dwunastościan-dwudziestościan
גיליון אלקטרוני להעלאת נתוני בעיה ויצירת גרף בהתאם
Viviani's Curve
Untitled
Descubrir recursos
modele_2_orbites-v2
Using Equations to Complete Tables 0024
Copia de Planetary Motion
Rotación
Rotation about origin
Is a Smartphone Smart Enough to Go to the Moon?: IM 8.7.16
Descubre los temas
Derivada
Función a trozos
Trazado de curvas
Suma
Cono