Google Classroom
Google Classroom
GeoGebra
Classe GeoGebra
Se connecter
Chercher
Google Classroom
Google Classroom
GeoGebra
Classe GeoGebra
Contenu
Statistiques: tableaux et graphiques
Points dans un repère
Lecture d'un tableau
Représenter graphiquement
Représenter la Proportionnalité
Diagrammes circulaires
Histogrammes
Exercices
Statistiques: tableaux et graphiques
Auteur :
classespeinal
Thème :
Statistiques
Table des matières
Points dans un repère
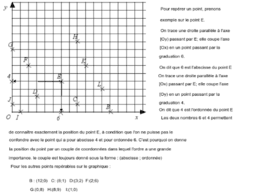
Vocabulaires et définitions
Lecture d'un tableau
Croisement d’une ligne et d’une colonne
Représenter graphiquement
Relation entre deux grandeurs
Représenter la Proportionnalité
Droite de représentation d'une proportionnalité
Diagrammes circulaires
Autre représentationn d'une étude statistique
Exemple
Histogrammes
Diagrammes en bâtons
Histogrammes
Exercices
Exercices avec Mathenpoche
Exercices dans la classe virtuelle WIMS
Suivant
Vocabulaires et définitions
Nouvelles ressources
Frère Jacques pour ggb v6 & 5.2 avec enveloppe
Vivaldi Concerto in C maj RV558 for ggb 6 & 5.2
Pain au levain.
Scan to show a conic related to d, F, e.
Les parterres de fleurs
Découvrir des ressources
كتاب الثبات الرقمي : الوضعية النسبية لدائرة و مستقيم- 7 أساسي
Intersection et réunion d'intervalles
La trisection d'angle.
Caractérisation de la médiatrice
Définition d'une Similitude
Découvrir des Thèmes
Nombres Complexes
Figures Planes
Combinatoires
Equations
Vecteurs 2D (dans le Plan)