The fly straight dammit sequence graph
Introduction
I learnt about this sequence from the Numberphile video:
Amazing Graphs
So I tried to plot it in GeoGebra using the definition provided here:
https://oeis.org/A133058
However, it seems that it is very hard for GeoGebra (classic 5) to handle more than 700 points from the sequence.
Anyway, try the following GeoGebra script in your desktop.
GeoGebra Script 1
#A[0]:= 1: A[1]:= 1:
#for n from 2 to 1200 do
#g:= igcd(A[n-1], n);
#A[n]:= A[n-1]/g + If(g=1, n+1, 0);
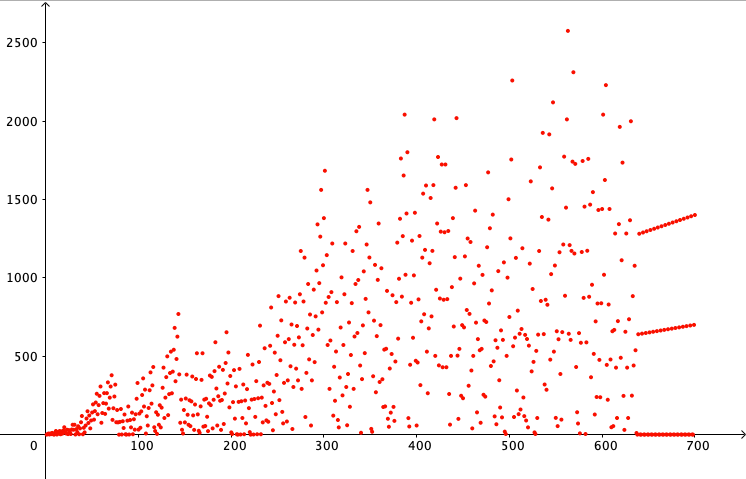
n = 700
Execute(Join({"A0 = 1", "A1 = 1"}, Sequence("A"+i+" = A"+(i-1)+"/GCD(A"+(i-1)+", "+(i)+")+If(GCD(A"+(i-1)+", "+(i)+")==1, "+i+"+1, 0)", i, 2, n)))
L_1 = CellRange(A1, A700)
L_2 = Sequence((k, Element(L_1, k)), k, 1, Length(L_1))
Result for n=700
Contribution
Thanks to Roman Chijner's suggestion there is a more efficient way to calculate the terms of the sequence for n>700.
GeoGebra Script 2
n=1200

A0 = 1

A1 = 1

Execute(Sequence("A"+i+" = CopyFreeObject(A"+(i-1)+"/GCD(A"+(i-1)+", "+(i)+")+If(GCD(A"+(i-1)+", "+(i)+")==1, "+i+"+1, 0))", i, 2, n))

L_1 = CellRange(A1, A1200)

L_2 = Sequence((k, Element(L_1, k)), k, 1, Length(L_1))