Delta Area with Position
[1] FROM DELTA BLOCKS TO DELTA AREA
There are some aspects of this simulation that are similar to the delta blocks activity and there are some differences.
Explore the simulation and keep track of the similarities and differences.
Note, the graphs disappear if any of the points are moved so that time would have to go backward (e.g., if C is located the left of B, the lines will disappear). The graph must be a function of time, f(t).
Set the initial floor of the elevator back to zero.
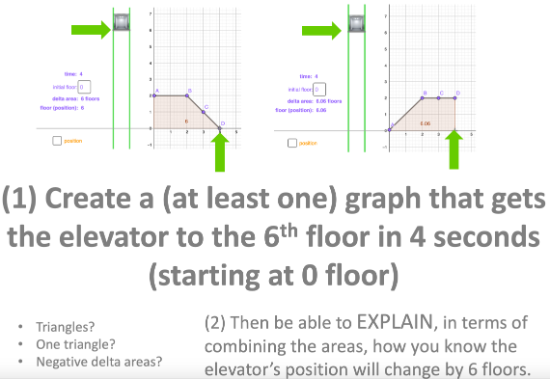
[2] CREATE YOUR OWN
Make your own graph that has the elevator start on floor zero and arrive at floor six after 4 seconds (t = 4 sec.)
Be able to explain, in terms of AREA(S), how your graph works.
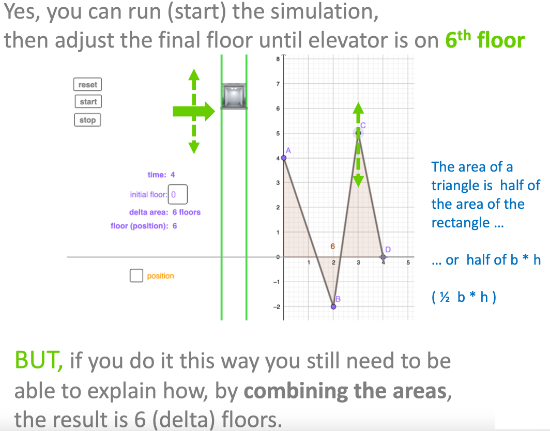
You can adjust graph until finial position is 6 ...
... but make sure you can explain in terms of the total AREA (delta area) or the graph.
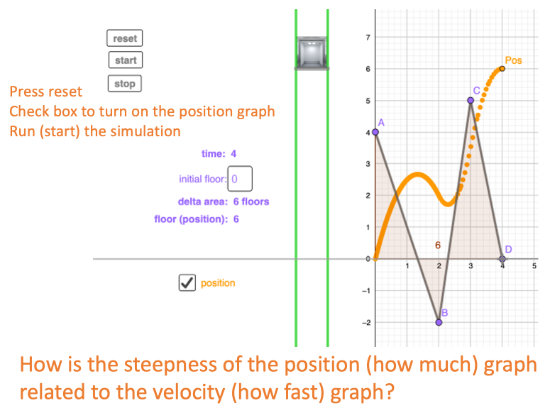
[3] POSITION GRAPH
Press reset and then click to turn on position as shown in image below.
How are aspects of each graph related to aspects of the other graph. Increasing/decreasing steepness? Where one graph through the axis what happens to the other graph?
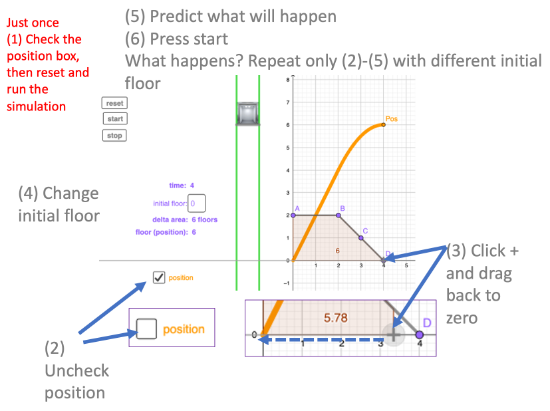
[4] DRAWING MORE THAN ONE POSITION GRAPH
Start with your graph.
Predict what the position graph might look like if you started the elevator on a different initial floor?
> Now we'll see how to have more than one position graph<
Press reset and then follow the steps below. Note, reset is only pressed this one time. Only steps 2-5 are repeated.
Try staring on a different initial floor and running the simulation
Is what happened with the position graphs what you expected? How so?
[5] CONSTANT VELOCITY AND THE AREA MODEL OF DIVISION
Return the initial position of your elevator to zero.
Press reset.
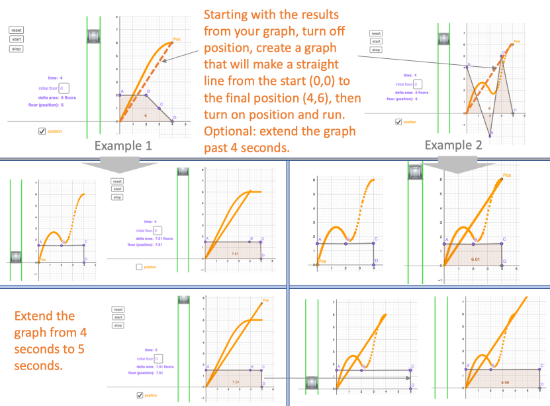
Starting from your graph and using the ability to draw more than one graph that we learned about in [4] above, try connecting the starting position (0,0) with the final position with a straight position graph.
AREA MODEL OF MULTIPLICATION - the height of a rectangle multiplied by the width is the area of a rectangle. For the elevator, if the side is 2 tall and the width is 3 the area is 6. This is the number of floors the elevator will travel.
AREA MODEL OF DIVISION - what if we know the area, 6 floors, and one of the sides, 3 seconds horizontally, then the height can be found by dividing the area by the side (6 fl ÷ 3 sec) to arrive at 2 (fl/sec).
The area model of division may help you come up with a straight position line connecting (0,0) to (4,6). We want to go 6 floors in 4 seconds.
What would happen if we extended this graph from 4 seconds to 5 seconds?
[6] PULLING IT ALL TOGETHER - Three position graphs to (4,3)
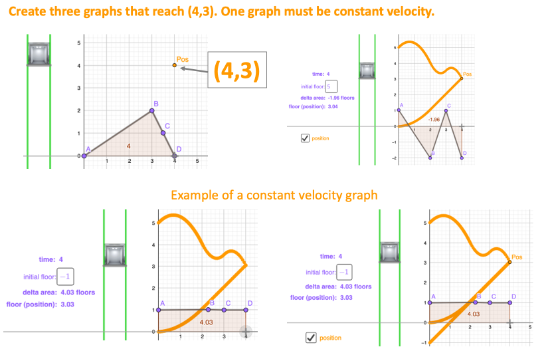
See if you can create THREE velocity graphs (and initial floors) that result in THREE position graphs that have the elevator be on floor four at three seconds (all three lines intersect at (4,3)).
The graphs do NOT have to all start at the origin (0,0).
One of the graphs must be a straight line position graph (like for [5])
An example is shown below.
[7] FINDING INTERESTING GRAPHS
Find on the internet at least one example of an interesting HOW FAST-like graph and one example of a HOW MUCH-type graph. Be ready to share each graph, say why you think it is interesting, and explain why you think the graph is either a HOW FAST-like graph or a HOW MUCH-like graph.