Google ClassroomGoogle Classroom
GeoGebraLección de GeoGebra

Half-Wave Zone Single-Slit Modeling: Visualizing Near-Field Diffraction and Complex Diffraction Integrals

This applet is an enhanced version of our previous applet for visualising near-field single-slit diffraction. It introduces the ability to visualise the complex vector summation from half-wave zones at an arbitrary point in the observation plane. Earlier versions, applets 1 and 2, were limited to the central axis.
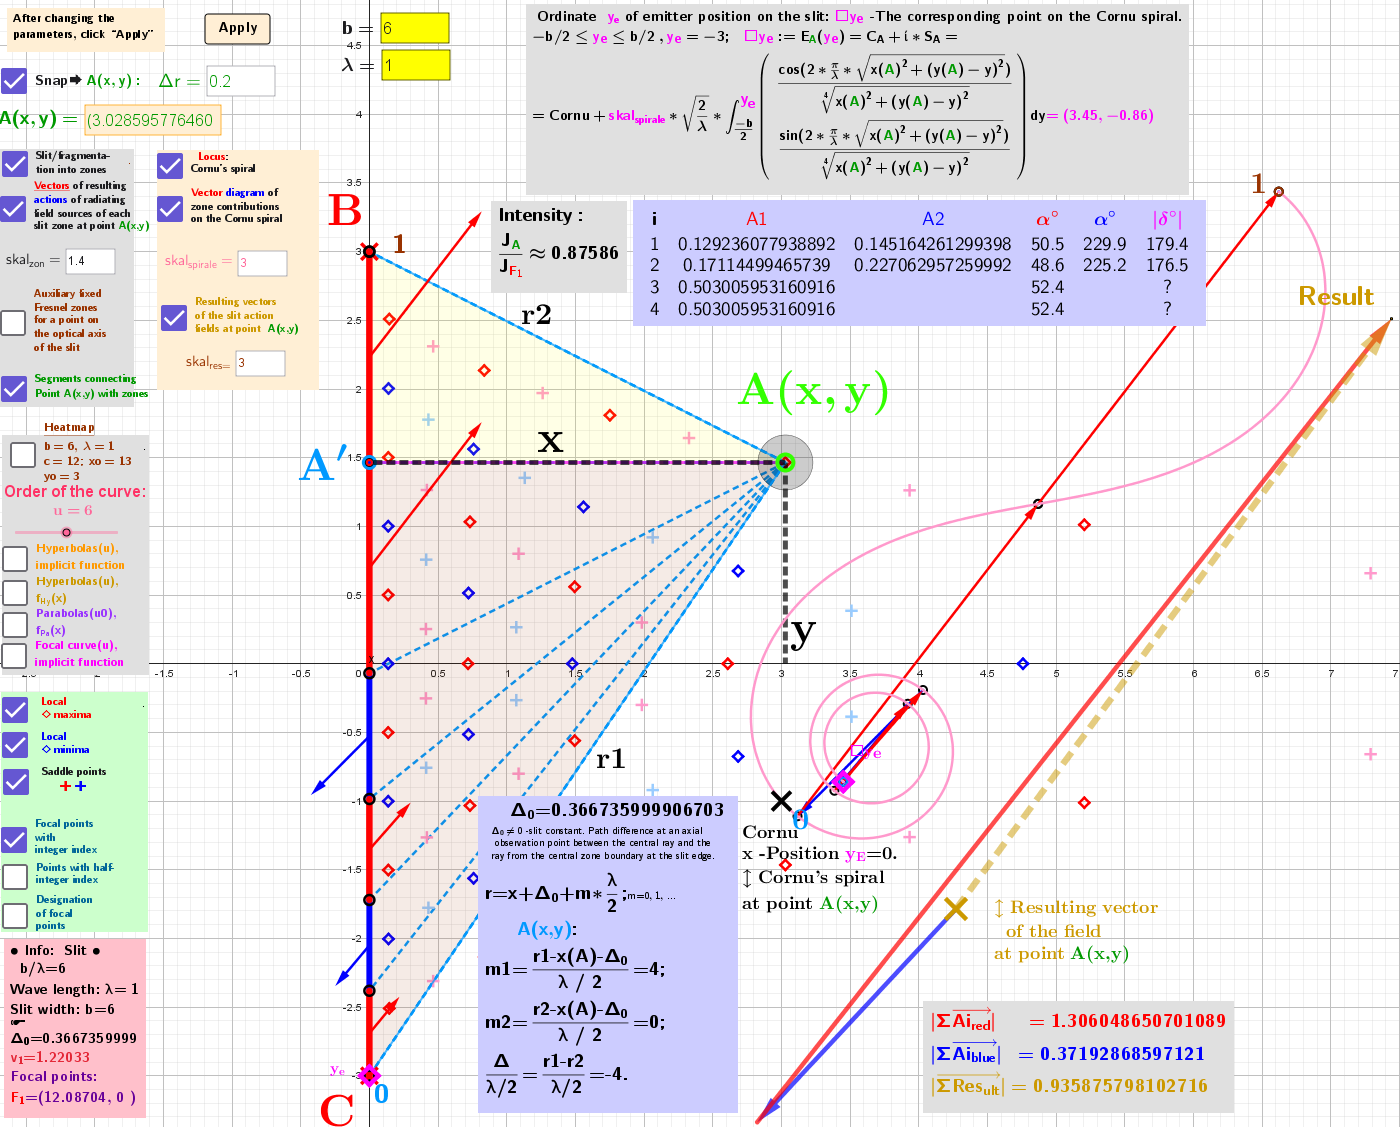
[size=85] [b]Fig. 1[/b]. Representation of complex diffraction integrals for diffraction by a single slit at a[b][color=#ff0000] local maximum[/color][/b] [b][color=#ff0000][size=100]◇[/size][/color][/b] point. Visualization of the resulting contributions from the zones.[/size]
Fig. 1. Representation of complex diffraction integrals for diffraction by a single slit at a local maximum ◇ point. Visualization of the resulting contributions from the zones.
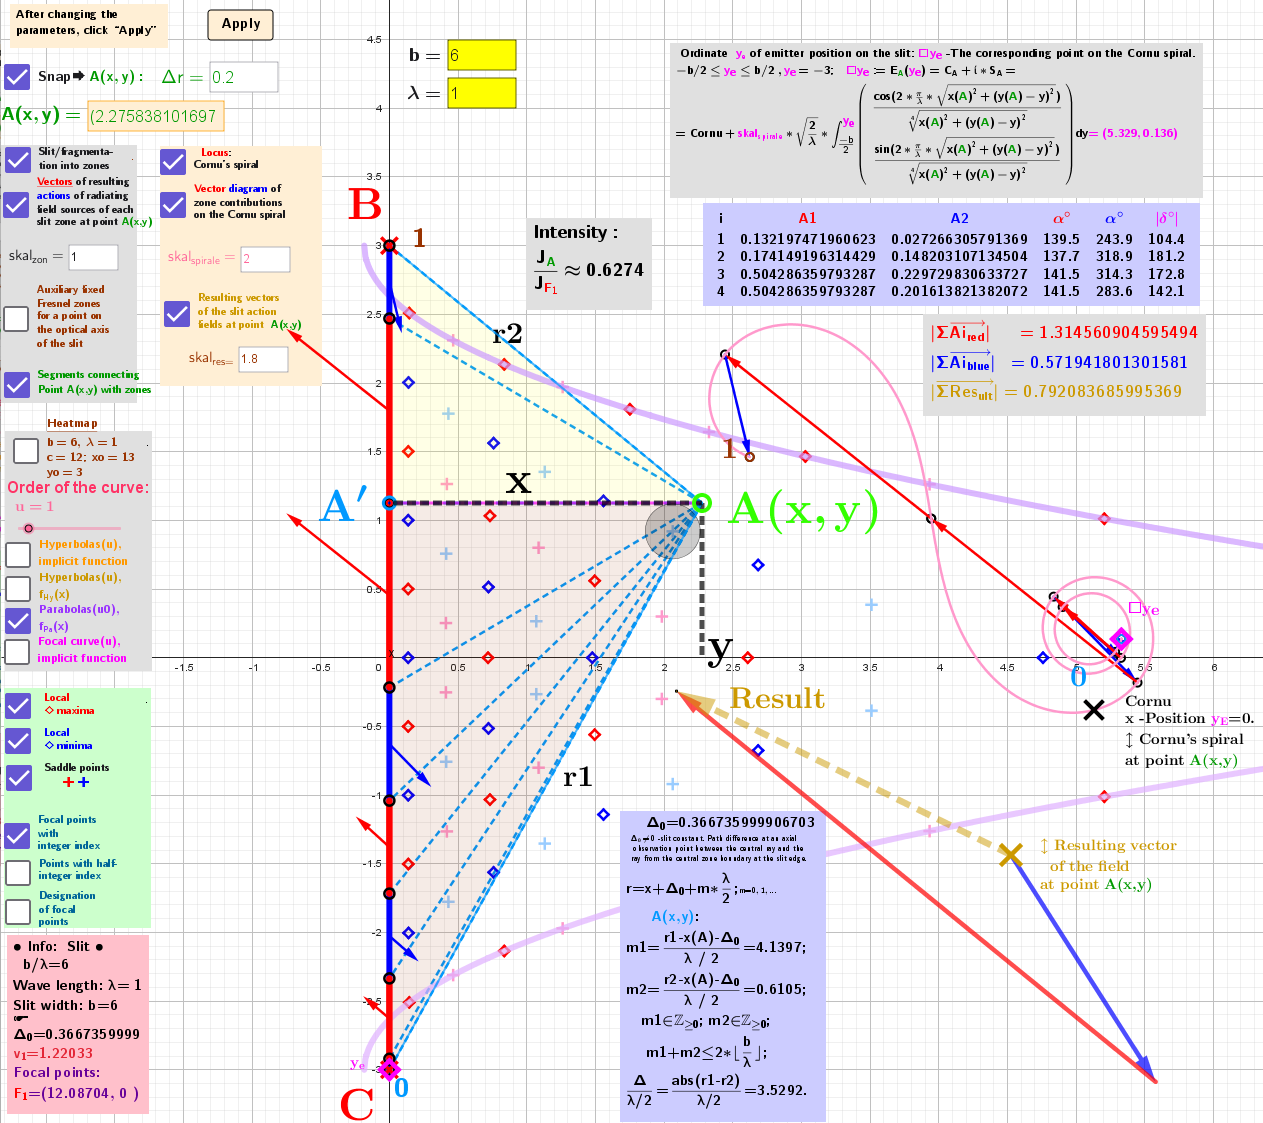
[size=85][b]Fig. 2[/b].  Representation of complex diffraction integrals for diffraction by a single slit at an [b][color=#93c47d]arbitrary point (let A(x,y))[/color][/b] in the diffraction field, other than its stationary points. Visualization of the resulting contributions from the zones. The vector triangle at point [b][color=#93c47d] A(x,y)[/color][/b] shows that the resultant field vectors from the even (red) and odd (blue) zones are [i]distinctly non‑parallel[/i].[/size]
Fig. 2. Representation of complex diffraction integrals for diffraction by a single slit at an arbitrary point (let A(x,y)) in the diffraction field, other than its stationary points. Visualization of the resulting contributions from the zones. The vector triangle at point A(x,y) shows that the resultant field vectors from the even (red) and odd (blue) zones are distinctly non‑parallel.