Google Classroom
Google Classroom
GeoGebra
Classe GeoGebra
Se connecter
Chercher
Google Classroom
Google Classroom
GeoGebra
Classe GeoGebra
Contenu
Statistica, grafici
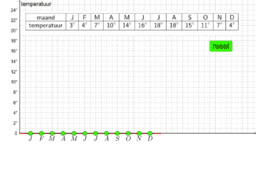
temperaturen in Brussel
Statistica, grafici
Auteur :
leucotea
Thème :
Statistiques
temperaturen in Brussel
Suivant
temperaturen in Brussel
Nouvelles ressources
Identità della calza di Natale o della mazza da hockey
La circonferenza del giardiniere
Pendenza e cartelli stradali
La stella di David e il triangolo di Tartaglia
Poligoni stellati regolari
Découvrir des ressources
Premessa
jovicirconferenza
Triangoli e mediane (1)
es 3 pag 201
Cornicetta
Découvrir des Thèmes
Volume
Trigonometrie
Entiers Naturels
Graphe de Fonction
Fonctions Quadratiques