Google Classroom
Google Classroom - Interaktiva lektioner
GeoGebra
GeoGebra Classroom - Interaktiva lektioner
Logga in
Sök
Google Classroom
Google Classroom - Interaktiva lektioner
GeoGebra
GeoGebra Classroom - Interaktiva lektioner
Utkast
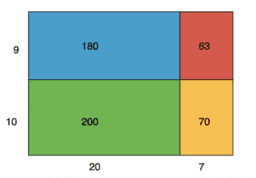
Using Diagrams to Represent Multiplication: IM 6.5.7
Lesson 6.5.7
Practice 6.5.7
Using Diagrams to Represent Multiplication: IM 6.5.7
Författare/skapare:
GeoGebra Classroom Activities
,
IM 6 – 8 Math
Område(n):
Aritmetisk
,
Diagram
,
Multiplikation
,
Tal
“Using Diagrams to Represent Multiplication”
from IM Grade 6 by
Open Up Resources
and Illustrative Mathematics. Licensed under the
Creative Commons Attribution 4.0 license
.
Innehåll
Lesson 6.5.7
IM 6.5.7 Lesson: Using Diagrams to Represent Multiplication
Practice 6.5.7
IM 6.5.7 Practice: Using Diagrams to Represent Multiplication
Nästa
IM 6.5.7 Lesson: Using Diagrams to Represent Multiplication
Nya resurser
Slope Between 2 Points (Phase 2)
bewijs stelling van Pythagoras
Model sferyczny - sześcian-ośmiościan
Trefoil Knot
Hyperbolic Paraboloid
Upptäck resurser
Statistical reasoning
Absolute Value Inequality Number Line
Angles in the same segment are equal
Monte Carlo Pi Confidence Interval
Undersök matematisk områden
Romb
Generell triangel
Polynomfunktioner
Sekant
Tangent