Google Classroom
Google Classroom
GeoGebra
GeoGebra Classroom
Abrir sesión
Buscar
Google Classroom
Google Classroom
GeoGebra
GeoGebra Classroom
Esquema
Charts & Graphs
Bar Chart Construction
Creating a Uniform Number Scale
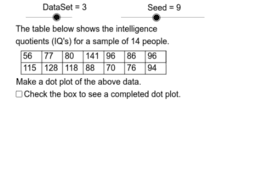
Dot Plot Construction Problems
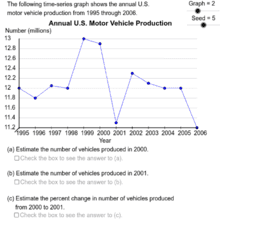
Time Series Analysis Problems
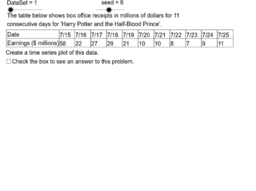
Time Series Construction Problems
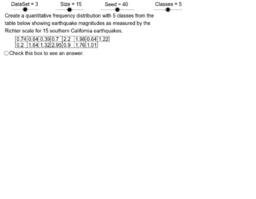
Quantitative Frequency Distribution Construction
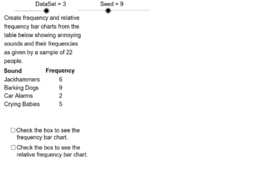
Relative Frequencies and Categorical Bar Charts
Relative Frequency Distribution Problems
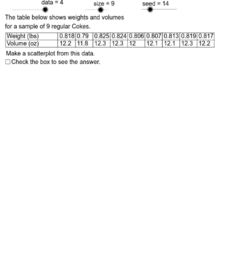
Scatter Diagram Construction Problems
Charts & Graphs
Autor:
David Gurney
Tema:
Estadística
This applet contains all my applets involving charts and graphs.
Bar Chart Construction
Creating a Uniform Number Scale
Dot Plot Construction Problems
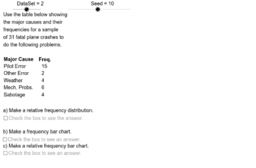
Time Series Analysis Problems
Time Series Construction Problems
Quantitative Frequency Distribution Construction
Relative Frequencies and Categorical Bar Charts
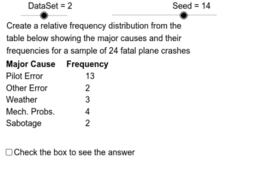
Relative Frequency Distribution Problems
Scatter Diagram Construction Problems
Siguiente
Bar Chart Construction
Nuevos recursos
Rose Curve
bewijs stelling van Pythagoras
Nikmati Keunggulan Di Bandar Judi Terpercaya
Model sferyczny - sześcian-ośmiościan
Cartesian vs Polar
Descubrir recursos
I nailed it Mr. Nelson #5
Flip-Checkboxes
Section d'une pyramide
Incentro
Modul 8B.5 Volume Bola_Fitri Agusrini_SMPN 56 Batam
Descubre temas
Congruencia
Geometría
Círculo
Integral Definida
MCM y MCD