Google Classroom
Google Classroom
GeoGebra
GeoGebra Classroom
Sign in
Search
Google Classroom
Google Classroom
GeoGebra
GeoGebra Classroom
Outline
M5: 14 Daten
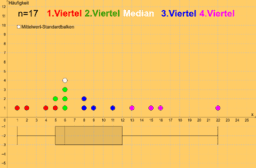
Boxplot: Datenaufteilung in Farbe
M5: 14 Daten
Author:
Matthias Hornof
Boxplot: Datenaufteilung in Farbe
Next
Boxplot: Datenaufteilung in Farbe
New Resources
Steigung und Steigungsdreieck
Die drei Gesichter der homogen linearen Funktion (Wertetabelle, Funktionsgleichung, Graph)
Anleitung: Funktionsgraph einer homogen linearen Funktion zeichnen
Ordne zu! - Funktionen und Steigung
Grafische Herleitung der 3. Binomischen Formel
Discover Resources
indirekt proportional
Lineare Funktion: Gerade aus zwei Punkten
Satz von Thales
Aufgabe 15 HÜ
Beispielaufgabe 28.09.2018
Discover Topics
Arithmetic Mean
General Quadrilateral
Means
Coordinates
Median Value