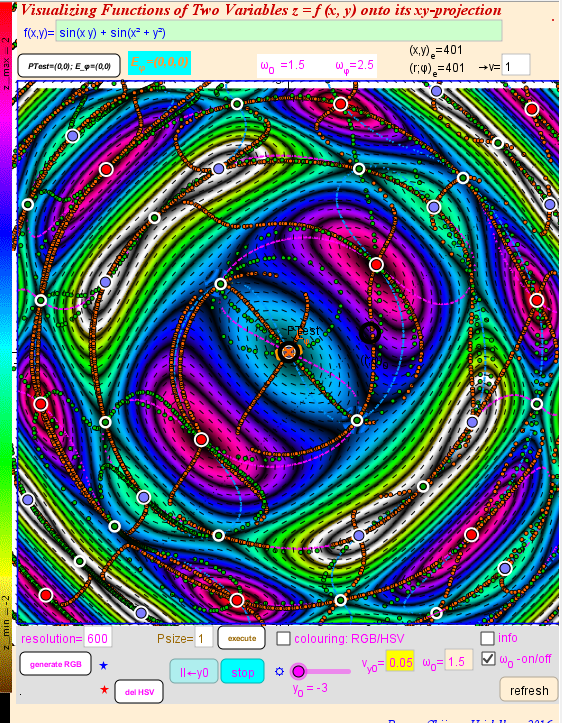
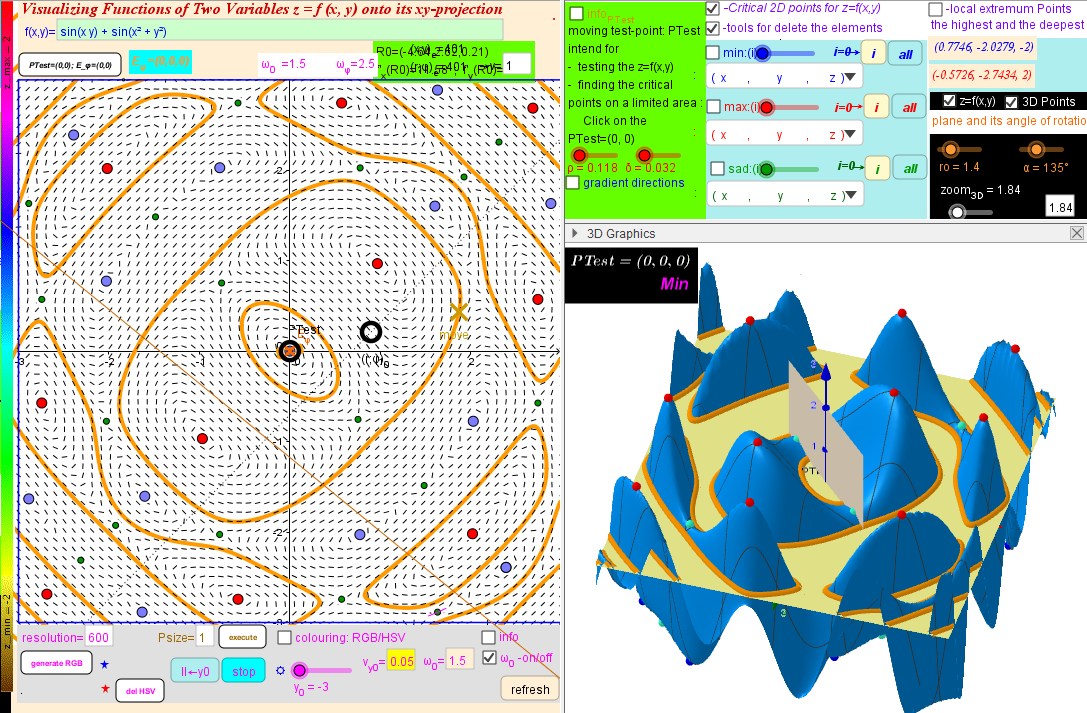
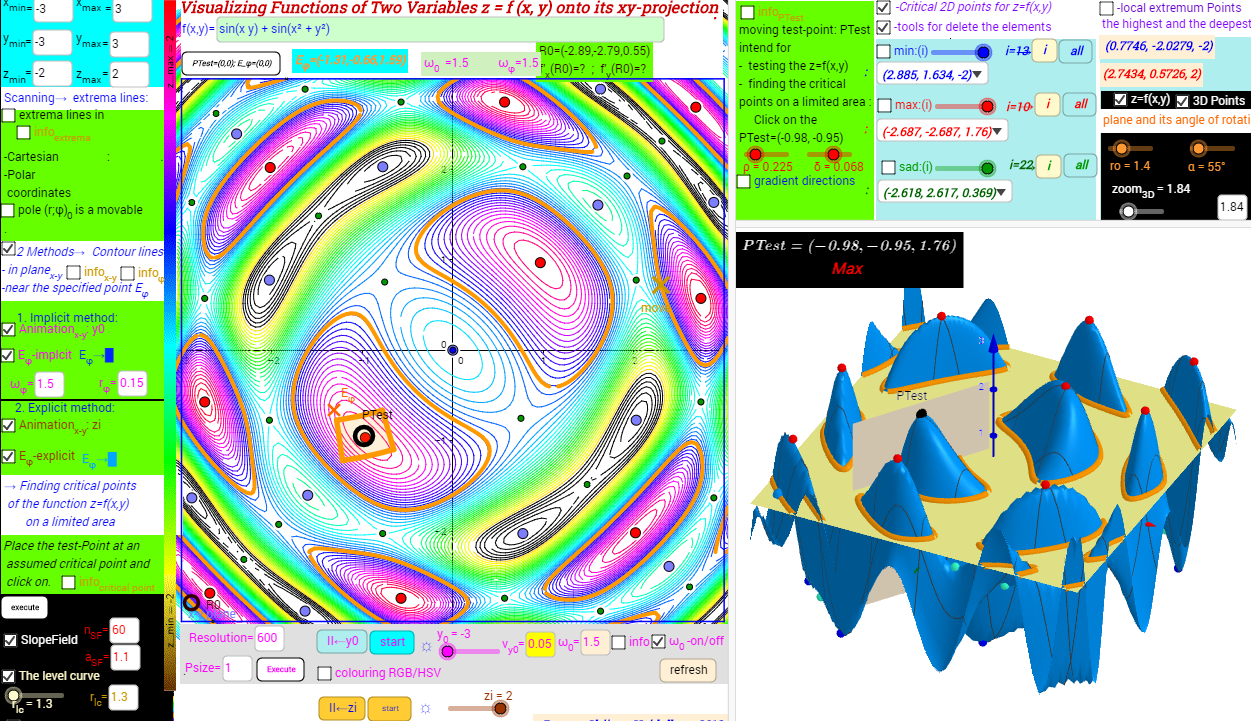
sin(x*y)+sin(x^2+y^2)- Images to Visualizing Functions of Two Variables
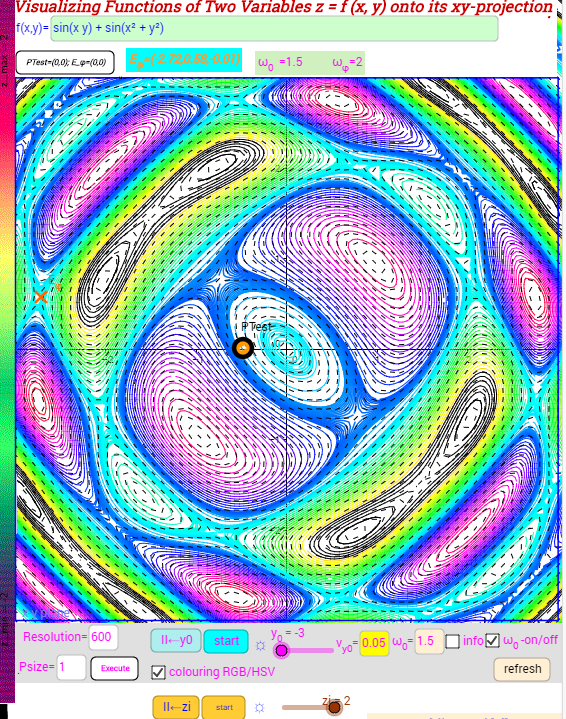
1. Slope Feld, level Curve, Critical Points, 3D Surface
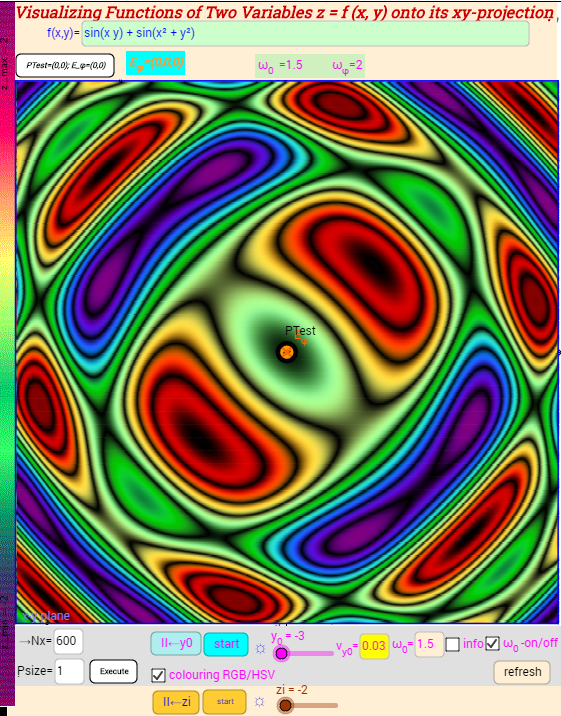
2. Extrema lines
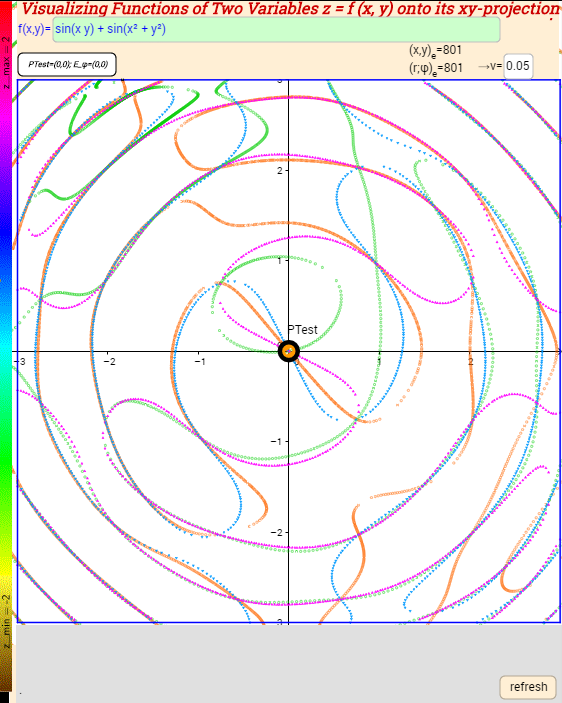
3. Contour lines in x-y Plane-Explicit Method, level Curve, , 3D Surface
4. Contour lines in x-y Plane-Explicit Method, Slope Feld
5. Contour lines in x-y Plane--Implicit Method, RGB Colouring
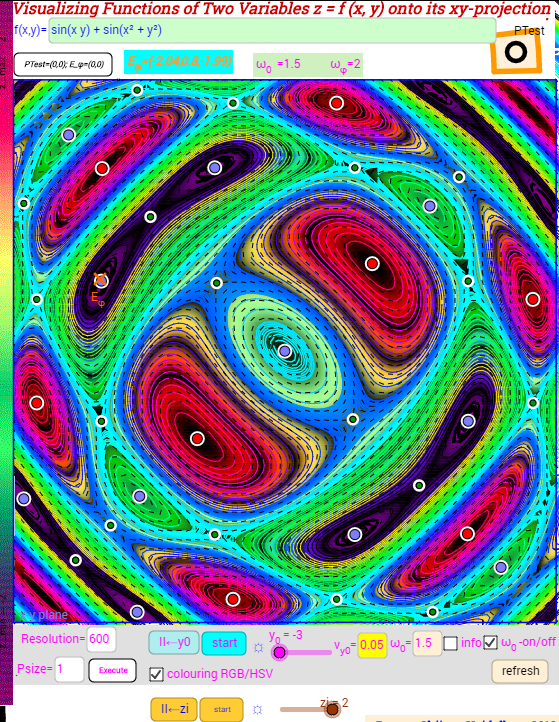
6. Contour lines in x-y Plane-Implicit and Explicit Methods, RGB Colouring, Slope Feld
7. Contour lines in x-y Plane-Implicit Method , HSV Colouring
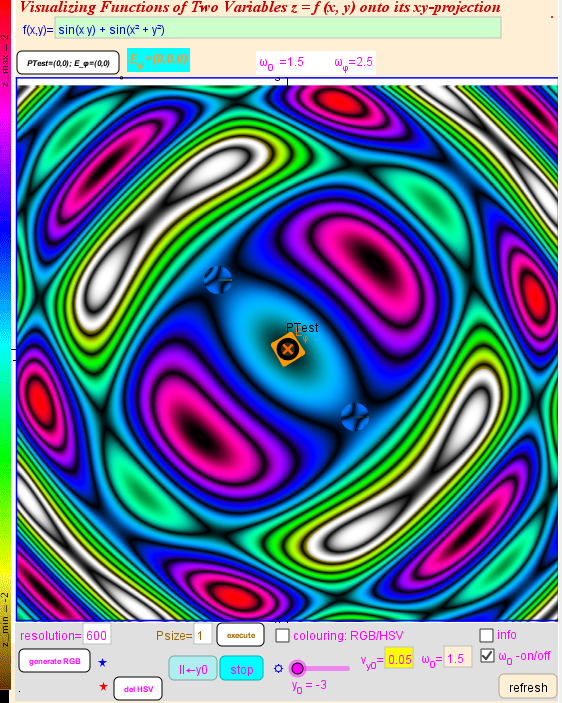
8. Contour lines in x-y Plane-Implicit Method , HSV Colouring, Extrema lines