Google Classroom
Google Classroom
GeoGebra
GeoGebra Classroom
Abrir sesión
Buscar
Google Classroom
Google Classroom
GeoGebra
GeoGebra Classroom
Esquema
Graphing for Reflections Practice
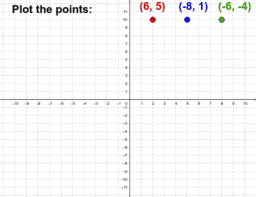
Plot Points
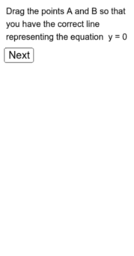
Lines representing equations of the form x = a and y = c
Graphing for Reflections Practice
Autor:
Kevin Westrich
Tema:
Simetría
Plot Points
Lines representing equations of the form x = a and y = c
Siguiente
Plot Points
Nuevos recursos
Some random function
¿Quién llegará más lejos en el mundial?
גיליון אלקטרוני להעלאת נתוני בעיה ויצירת גרף בהתאם
Fourier Lissajous (Mechanical)
seo tool
Descubrir recursos
Examples of the Sequence Command
Untitled
สามเหลี่ยมพีทาโกรัส
Does a Triangle have a Center?
Descubre temas
Cálculo de intereses
Distribución binomial
Perímetro
Ecuación diferencial
Diagrama de cajas