Google Classroom
Google Classroom
GeoGebra
Classe GeoGebra
Se connecter
Chercher
Google Classroom
Google Classroom
GeoGebra
Classe GeoGebra
Contenu
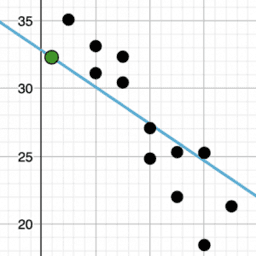
Describing Trends in Scatter Plots
Spot the Odd One out
Some more Practice
Describing Trends in Scatter Plots
Auteur :
Lee McCulloch-James
,
IM 6 – 8 Math
,
GeoGebra Classroom Activities
Describing Trends in Scatter Plots Resources[/url] and Illustrative Mathematics. Licensed under the
Creative Commons Attribution 4.0 license
.
Table des matières
Spot the Odd One out
Describing Trends in Scatter Plots
Some more Practice
Describing Trends in Scatter Plots
Suivant
Describing Trends in Scatter Plots
Nouvelles ressources
seo tool
Damped Trochoidal Curve
רישום חופשי
Slope Between 2 Points (Phase 2)
အခြေခံ data အခေါ်အဝေါ်များ
Découvrir des ressources
Function Transformations (Algebra II)
Triangular pyramid for teachers
TR (KAY) - Όρια
Distance #2
DM_U1Project_JacobP_Period8
Découvrir des Thèmes
Valeur Attendue
Nombres Rationnels
Fonctions Exponentielles
Fonctions Puissances
Loi Normale