Google Classroom
Google Classroom
GeoGebra
GeoGebra Classroom
Anmelden
Suche
Google Classroom
Google Classroom
GeoGebra
GeoGebra Classroom
Kapitel
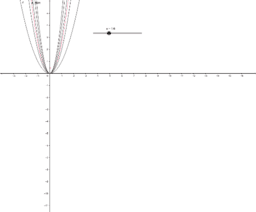
이차함수의 그래프에서 최고차항의 계수와 그래프의 폭의 관계
y=ax^2(a>0)의 그래프
y=ax^2(a<0)의 그래프
y=ax^2의 그래프
이차함수의 그래프에서 최고차항의 계수와 그래프의 폭의 관계
Autor:
rlathgus4582
이차함수의 최고차항의 계수의 절댓값이 클수록 그래프의 폭이 좁아지고 y축에 가까워진다.
Inhaltsverzeichnis
y=ax^2(a>0)의 그래프
이차함수와 그래프의 폭1
y=ax^2(a<0)의 그래프
이차함수와 그래프의 폭2
y=ax^2의 그래프
이차함수와 그래프의 폭3
Weiter
이차함수와 그래프의 폭1
Neue Materialien
뫼비우스의 띠와 클라인 병
공통수학1_복소수
테스트
Perspective projection 원근 투영
다항식의 곱셈과 나눗셈
Entdecke Materialien
적분의 정의
표준정규분포표(p-->z)
두 원의 공통 접선
삼각함수 사인함수의 복사본
과제
Entdecke weitere Themen
Geometrisches Mittel
Differenzenquotient und Steigung
Abschnittsweise definierte Funktionen
Gleichseitige Dreiecke
Algebra