Google Classroom
Google Classroom
GeoGebra
Classe GeoGebra
Se connecter
Chercher
Google Classroom
Google Classroom
GeoGebra
Classe GeoGebra
Contenu
CP Statistics
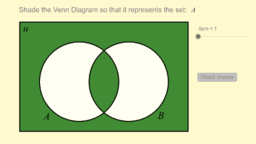
Shading Venn Diagrams (1)
CP Statistics
Auteur :
Justin Wingard
Thème :
Statistiques
Shading Venn Diagrams (1)
Suivant
Shading Venn Diagrams (1)
Nouvelles ressources
Model sferyczny - dwunastościan-dwudziestościan
seo tool
Fourier Lissajous (Mechanical)
Slope Between 2 Points (Phase 2)
apec
Découvrir des ressources
NewYork
Snowman
day 87 (2)
Intersección entre 2 planos
Découvrir des Thèmes
Cône
Cercle Inscrit ou Circonscrit
Solides de l'Espace
Addition
Cosinus