Google Classroom
Google Classroom
GeoGebra
GeoGebra Classroom
Sign in
Search
Google Classroom
Google Classroom
GeoGebra
GeoGebra Classroom
Outline
Intro to Stats
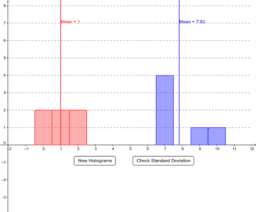
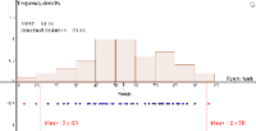
AQR Section 17: Which Histogram has more Variation?
Histograms, mean and standard deviation
Intro to Stats
Author:
Ms. Melanie Kachinsky
AQR Section 17: Which Histogram has more Variation?
Histograms, mean and standard deviation
Next
AQR Section 17: Which Histogram has more Variation?
New Resources
רישום חופשי
Angle Addition: Warm Up Exercises
Nikmati Keunggulan Di Bandar Judi Terpercaya
Rose Curve
Model sferyczny - dwunastościan-dwudziestościan
Discover Resources
test integrale
הזזה אנכית
Quadratic Inequalities
sum of integers
Euclid Book 1, Proposition 2
Kukeldash madrassa - gp and ks
Discover Topics
Constructions
Pie Chart or Circle Chart
Diagrams
Trigonometric Functions
Centroid or Barycenter