Unwrapping the Unit Circle
A sketch to show how the sine, cosine and tangent values on the unit circle are sketched in order to graph trig values. Follow the directions below the applet to help guide you through this activity.
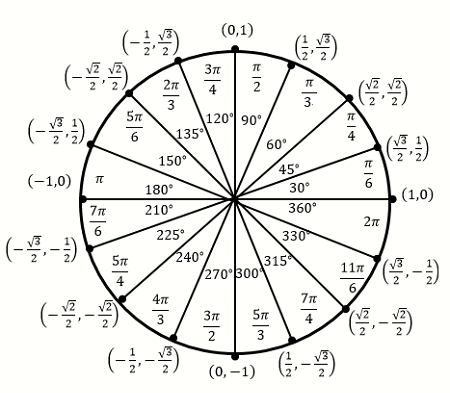
Here is a copy of your unit circle.
Select the checkbox that says "sin". Then, select the play button in the applet on the bottom left hand corner and let the animation play for a few revolutions around the unit circle.
What do you notice about the values of sine on the unit circle and the graph of sine? How do we create the sine graph using the unit circle?
Now, deselect sin and select cos. Play the animation again. You can refresh the page by clicking on the refresh button in the top right hand corner of the applet.
What about cosine? How do we create the cosine graph using the unit circle?
Now, try tangent.
What do you notice about the graph of tangent that is different from the graph of sine and cosine?
What questions do you have about the graphs above or about the unit circle?