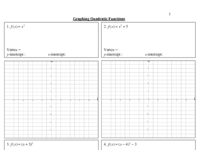
Graph of a Quadratic Functions
Good morning class!
Welcome to another day filled with enjoyable activities and learning!
What do these pictures have the same in common?


DEFINITION OF TERMS
domain of quadratic function - the set of all possible values of x. Thus, the domain is the set of all real numbers.
range of quadratic functions – consists of all y greater than or equal to the y coordinate of the vertex if the parabola opens upward.
intercepts or zeroes of quadratic functions – the values of x when y equals 0. The real zeros are the x-intercepts of the function’s graph.
axis of symmetry / line of symmetry– the vertical line through the vertex that divides the parabola into two equal parts.
vertex – the turning point of the parabola or the lowest or highest point of the parabola. If the quadratic function is expressed in the standard form y = a(x-h)2+ k, the vertex is the point of (h,k).
direction of the opening of the parabola – can be determined from the value of a in f(x) = ax2+bx + c. If a>0, the parabola opens upward; if a<0, the parabola opens downward.
maximum value – the maximum value of f(x) = ax2+bx + c where a< 0, is the y coordinate of the vertex.
minimum value – the minimum value of f(x) = ax2+bx + c where a> 0, is the y coordinate of the vertex.
parabola – the graph of quadratic function
quadratic function – a second- degree function of the form f(x) = ax2+bx + c, where a, b, and c are real numbers and a≠0. This is a function which describes a polynomial
Try to answer the following activity, observe the behavior of the graph of a quadratic function as you changes the values of a, b, and c. Write your observation below.
Watch this video and learn how to graph a quadratic equation.
Answer the following activity. (just choose 3 items in part 1 and other 3 in part 2.
THANK YOU FOR TODAY!